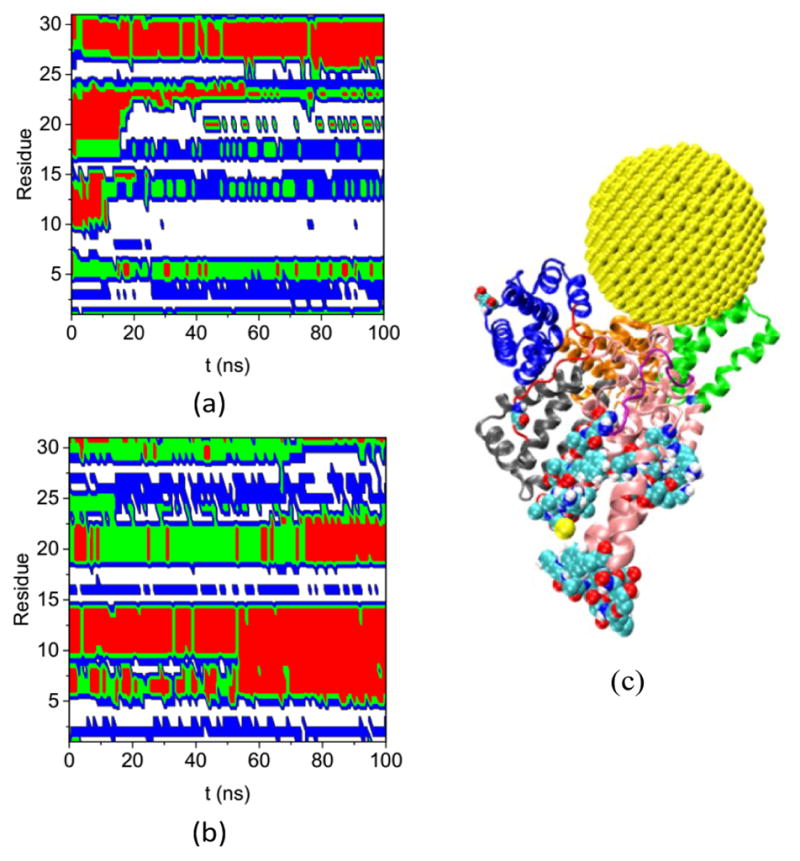
Fig. 8.

Secondary structure of residues that have ΔSeci >0.5 and di > 5.0 nm on the HSA protein in (a) Complex A and (b) bulk solution during the course of the simulation. (coil: white, bend: blue: turn: green, and red: helix), (c) the configuration of Complex A at 200 ns molecular dynamics (MD) simulation. The subdomains and loops are shown in secondary structure with the same color as in Figure 3. The 31 residues are shown in the VDW model.
