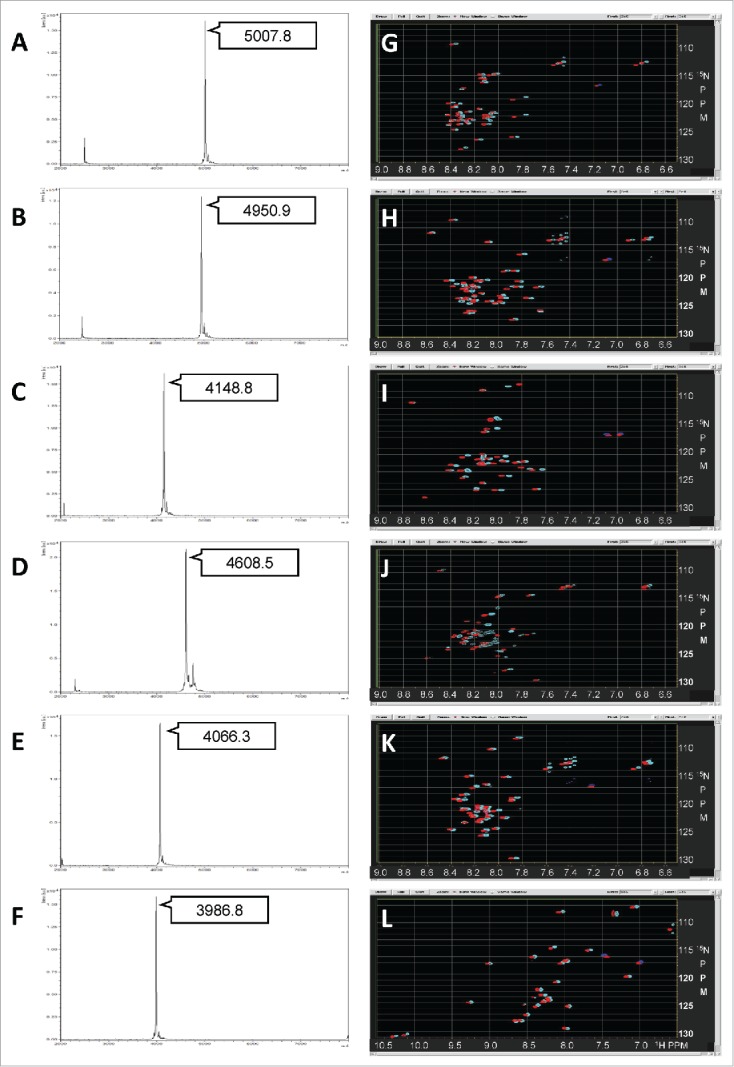
Figure 2.

MALDI-TOF mass spectra and HSQC/SOFAST-HMQC spectra of purified IDPs. MALDI-TOF mass spectra (A–F) and NMR spectra (G–L). In the NMR spectra, the SOFAST-HMQC spectrum measured in the buffer with 0 M NaCl is shown in cyan, whereas the HSQC spectrum in 0.5 M NaCl is shown in red. (A, G) IDP(B3), (B, H) IDP(B4), (C, I) IDP(C1), (D, J) IDP(D10), (E, K) IDP(E1), (F, L) “partial”-IDP(C9).
