
Figure 1.
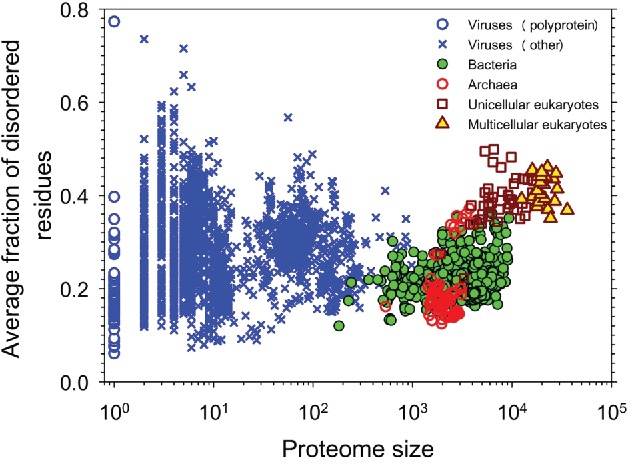
Correlation between the intrinsic disorder content and proteome size for 3,484 species from viruses, archaea, bacteria, and eukaryotes. Each symbol indicates a species. There are totally six 6g groups of species: viruses expressing one polyprotein precursor (open blue circles), other viruses (blue crosses), bacteria (green circles), archaea (red open circles), unicellular eukaryotes (brown open squares), and multicellar eukaryotes (yellow triangles). Each viral polyprotein was analyzed as a single polypeptide chain, without parsing it into the individual proteins before predictions. The proteome size is the number of proteins in the proteome of that species shown in the log base. The average fraction of disordered residues is calculated by averaging the fraction of disordered residues of each sequence over the all sequences of that species. Disorder prediction is evaluated by PONDR® VSL2B. Based this plot is based on data published in ref.16