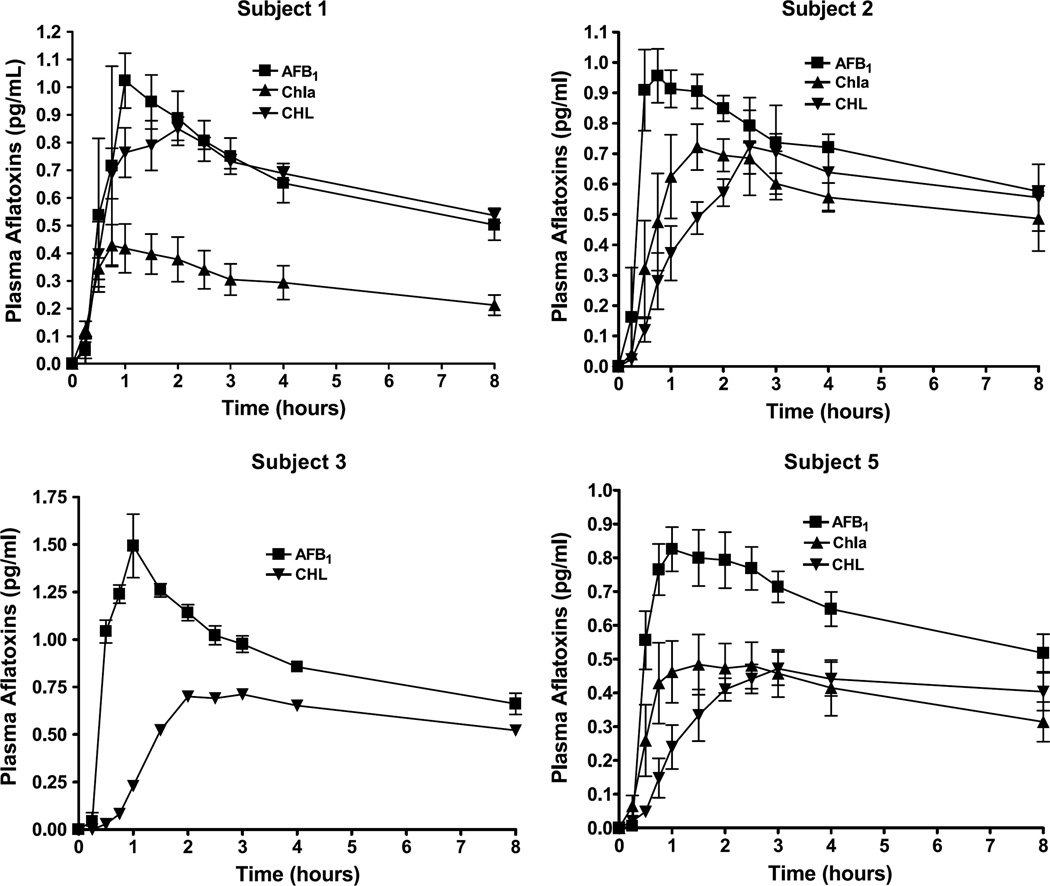
Fig. 2.
Pharmacokinetic profiles of aflatoxin equivalents from plasma samples collected at 0.25, 0.5, 0.45, 1.0, 1.5, 2.0, 2.5, 3.0, 4.0, and 8.0 h. Aflatoxin concentration is derived from AMS analysis based on total 14C from aliquots of plasma samples and is presented as mean ± SD (n = 3 independent trials).

