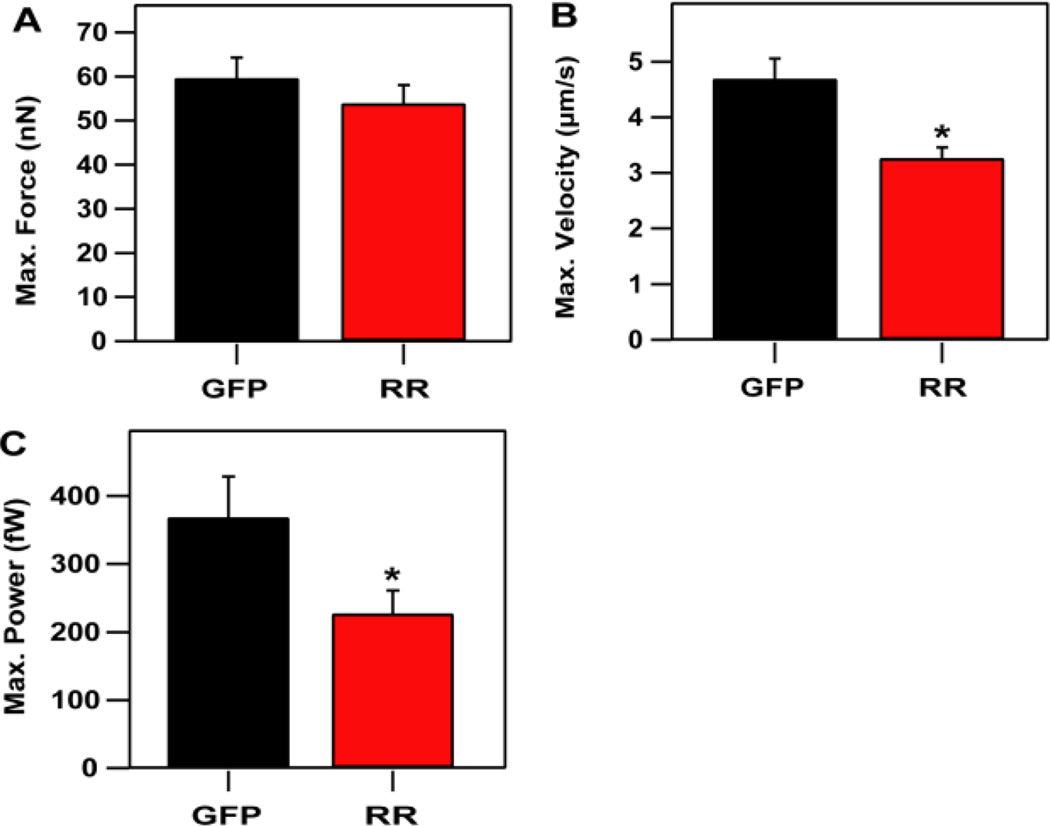
Figure 1.
Twitch velocity and power decrease with increased dATP production in RR + GFP-expressing cells (RR), but twitch forces are unaffected. (A) Maximum twitch forces were not significantly altered by over-expressing RR (53.9 ± 4.1 nN) when compared to control cells expressing GFP (59.7 ± 4.6 nN). (B) Maximum twitch velocity was significantly lower in RR + GFP-expressing cells (3.27 ± 0.19 µm/s) than in GFP-expressing control cells (4.69 ± 0.36 µm/s). (C) Maximum twitch power was lower in RR + GFP-expressing cells (227 ±34 fW) than in GFP-expressing cells (369 ±60 fW). Data shown for RR+GFP-expressing cells is from 29 micropost measurements taken from 15 cells. Data shown for GFP-expressing cells is from 27 micropost measurements taken from 13 cells. Three replicate experiments were conducted for each condition.

