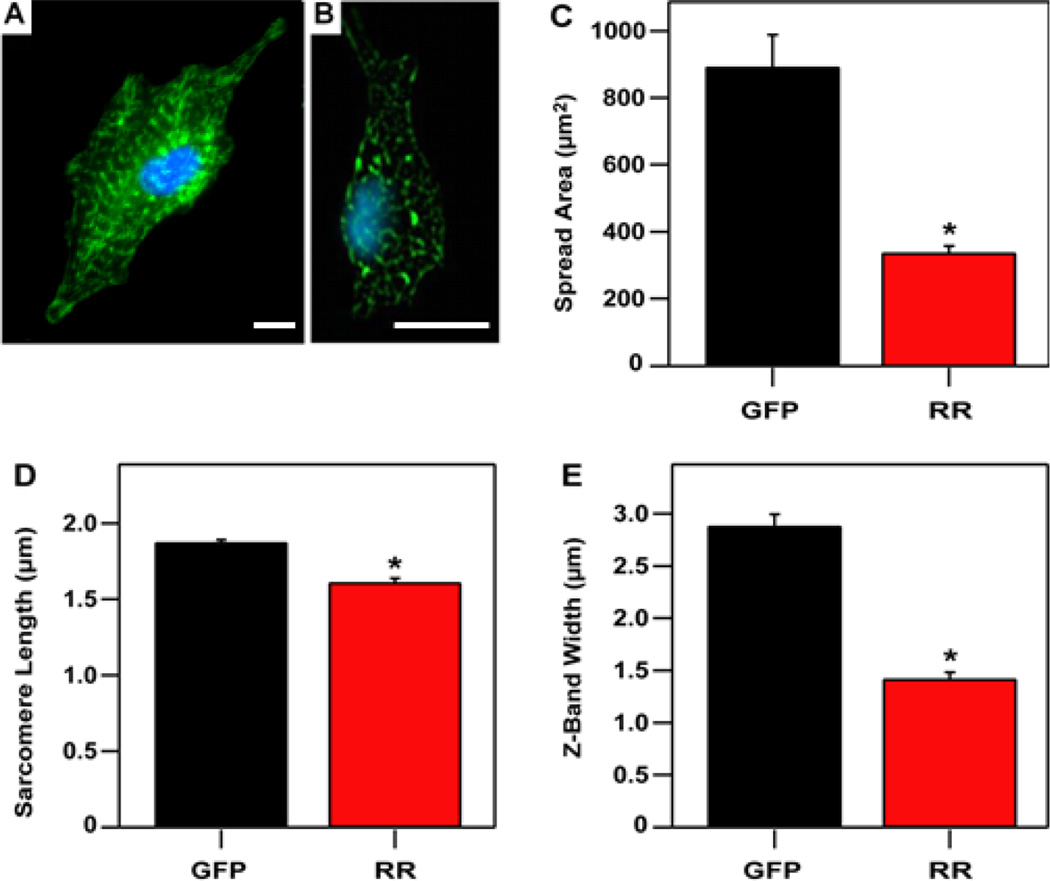
Figure 2.
Cytosolic dATP reduces hypertrophic growth and myofibril structure. Fluorescent images showing nuclei (cyan) and α-actinin (green) for representative cells expressing (A) RR + GFP or (B) GFP. (C) Spread area was significantly less for RR + GFP-expressing cells (338 ± 19 µm2) than for GFP-expressing cells (893 ± 95 µm2). (D) Sarcomere lengths (1.61 ± 0.03 µm for RR + GFP cells and 1.88 ± 0.02 µm for GFP cells) and (E) Z-band widths (1.42 ± 0.06 µm for RR + GFP cells and 2.89 ± 0.11 µm for GFP cells) are also significantly reduced with the expression of RR. Scale bar represents 10 µm. n = 4 cells (from each group).

