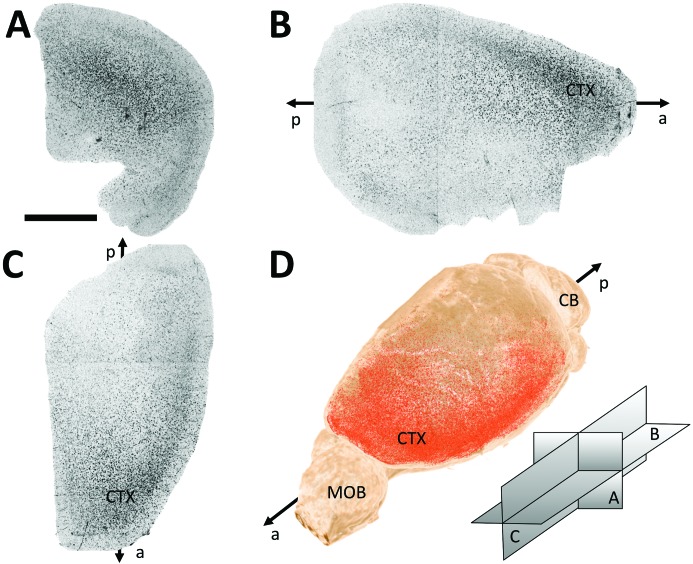
Figure 5.
Projections (coronal A, axial B and sagittal C; orientation scheme shown in D) of the plaque signals (black trace) in a representative three-dimensional brain sample. Three-dimensional rendering with the segmented plaques in red (D). Cortex (CTX), cerebellum (CB) and main olfactory bulb (MOB) regions are indicated along the antero-posterior axis of the brain. Scale bar 2 mm.

