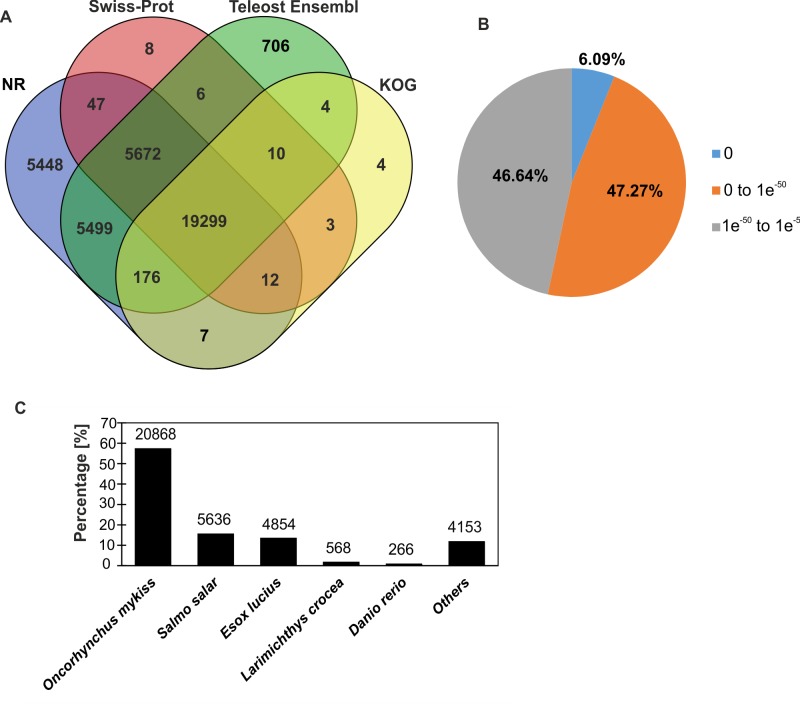
Fig 1. Characteristics of the homology search of sea trout transcripts.
(A) Venn diagram illustrating the distribution of matches against four public databases (NCBI nr, Swiss-Prot, Teleost Ensembl and KOG databases). In total, 36,902 (48.57%) transcripts were annotated. (B) E-value and (C) species distribution of the best hits based on the NCBI nr database.

