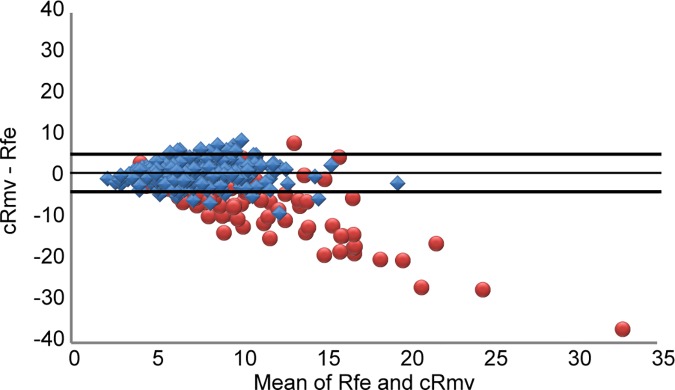
Fig 10. Bland-Altman plot of differences in airway resistance (cRmv–Rfe) against the mean of Rfe and cRmv.
Blue dots represent patients with a normal FEV1/FVC ratio, and the middle, top, and bottom black lines represent the mean difference, and boundaries of the 95% limits of agreement, respectively. Red dots representing patients with an FEV1/FVC ratio < 70% were also added for contrast.

