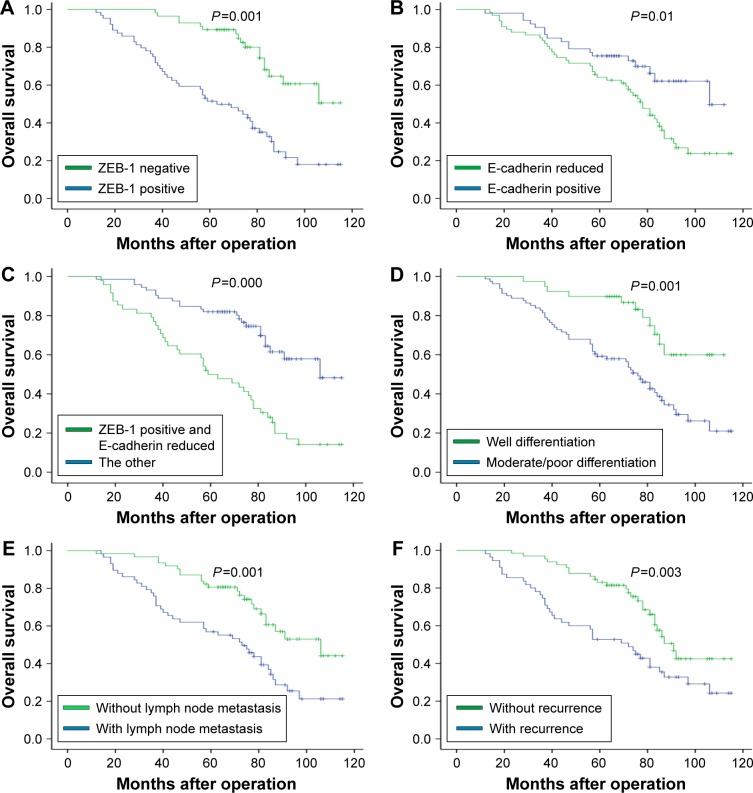
Figure 3.
Kaplan–Meier survival curve for overall survival according to each immunohistochemical staining group and different clinical factors.
Notes: (A and B) shows the overall survival curves after surgery according to ZEB-1 and E-cadherin expression; (C) displays the 5-year overall survival rates were significantly poorer in the ZEB-1 positive and loss of E-cadherin expression group than in other expression groups; (D–F) shows that patients with moderate/poor differentiation, lymph node metastasis and recurrence have worse prognosis.
Abbreviation: ZEB-1, zinc-finger E-box binding homeobox 1.

