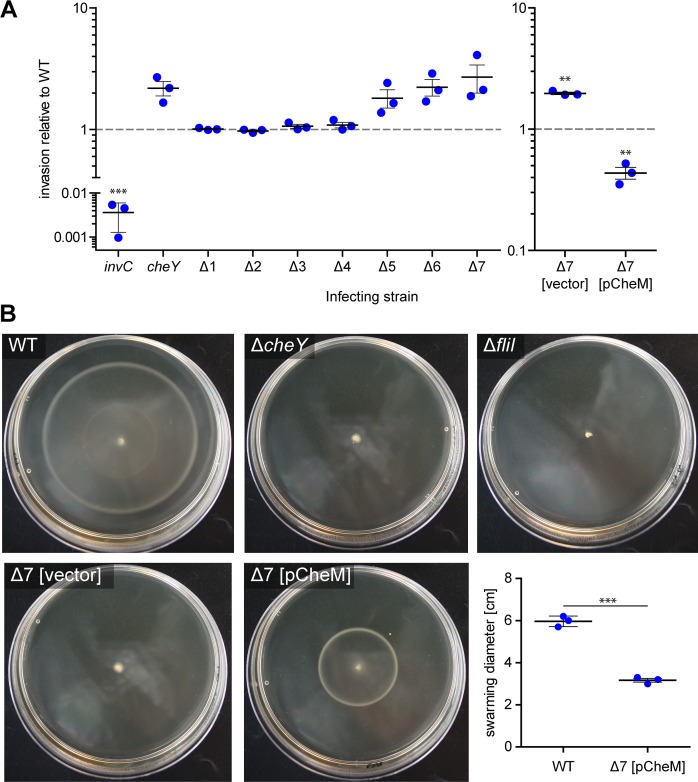
Fig 3. Functional characterization of the WRG279 mutant.
(A) HeLa cells were infected with different STM strains and relative invasion rates compared to STM WT were calculated after one hour of infection. An invC mutant lacking a functional T3SS-1 was used as a negative control for invasion and a motile but non-chemotactic cheY mutant was included to evaluate the impact of directed motility. The Δ1 to Δ7 strains represent sequential MCP deletions as follows: Δ1 = WRG246 Δaer; Δ2 = WRG255 Δaer, Δtcp; Δ3 = WRG260 Δaer, Δtcp, Δtsr; Δ4 = WRG264 Δaer, Δtcp, Δtsr, Δtrg; Δ5 = WRG269 Δaer, Δtcp, Δtsr, Δtrg, ΔcheM; Δ6 = WRG277 Δaer, Δtcp, Δtsr, Δtrg, ΔcheM, ΔmcpC; Δ7 = WRG279 Δaer, Δtcp, Δtsr, Δtrg, ΔcheM, ΔmcpC, ΔmcpB. The right panel shows the invasion rates of the Δ7 strain complemented with pCheM (pWRG847) or transformed with the empty vector pWSK29 (vector). Statistical significance was calculated using a one sample t test against the hypothetical value 1.0 and was defined as ** for p < 0.01 and *** for p < 0.001. (B) Swarming phenotypes of different Salmonella strains as indicated on LB soft agar plates. Depicted is one representative out of three similar experiments. The diagram in the lower right panel shows the diameter of the swarming rings of S. Typhimurium WT and the Δ7 MCP mutant complemented with a CheM expression plasmid or a vector control as described in (B). Data of three independent biological replicates including means and standard deviations are shown. Statistical significance was calculated using a two-tailed paired Student’s t test and was defined as *** for p < 0.001.

