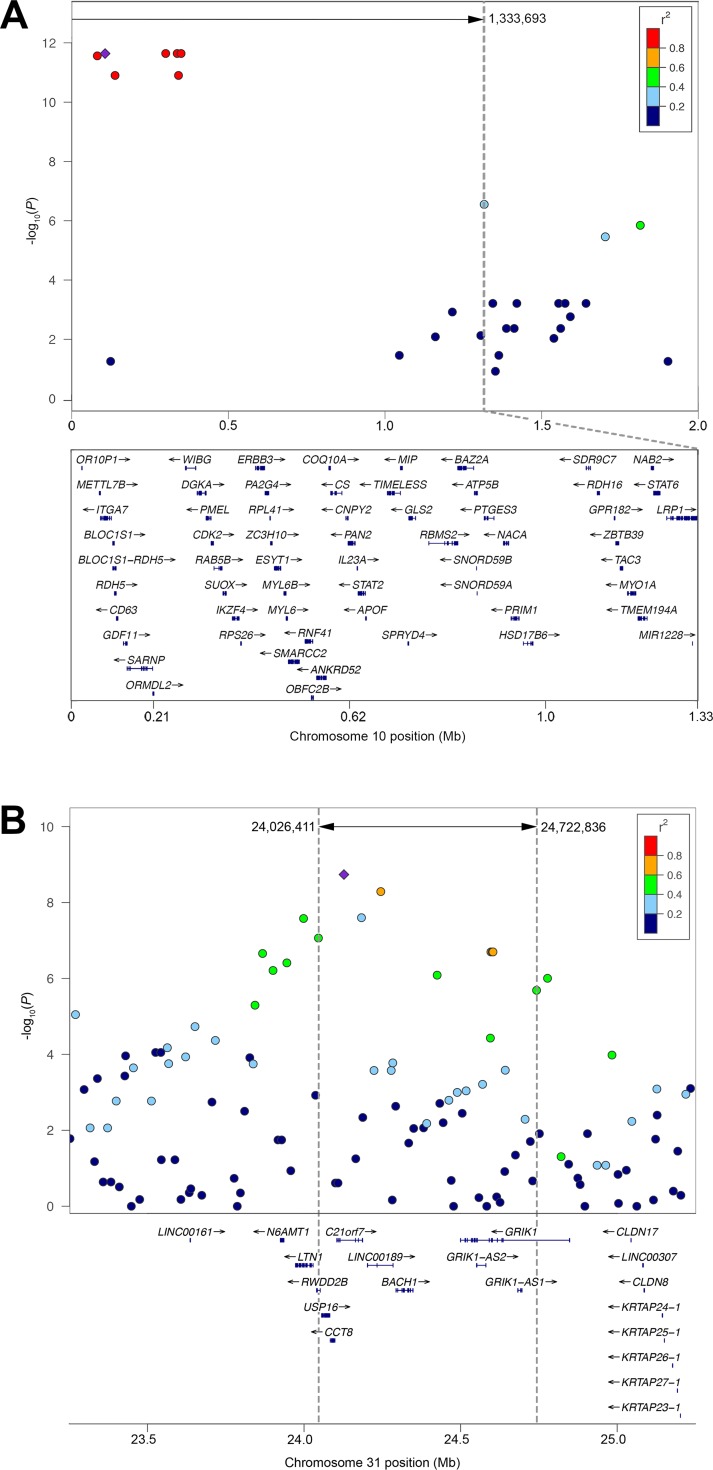
Fig 2. Regional plots depicting LD at two associated loci.
Association results (-log10P) for (A) combined breed GWAS on chromosome 10 and (B) Shetland sheepdog GWAS on chromosome 31 are color-coded based on pairwise LD (r2) with the lead SNPs (purple diamond). Dotted lines demarcate the candidate interval. Genes within the region (based on hg18) are shown below the plot with chromosome positions reported in canFam3. On chromosome 10, the gene track is zoomed in to represent the candidate interval only; 4 genes were omitted from the figure (DNAJC14, LOC440104, MMP19, and SLC39A5).

