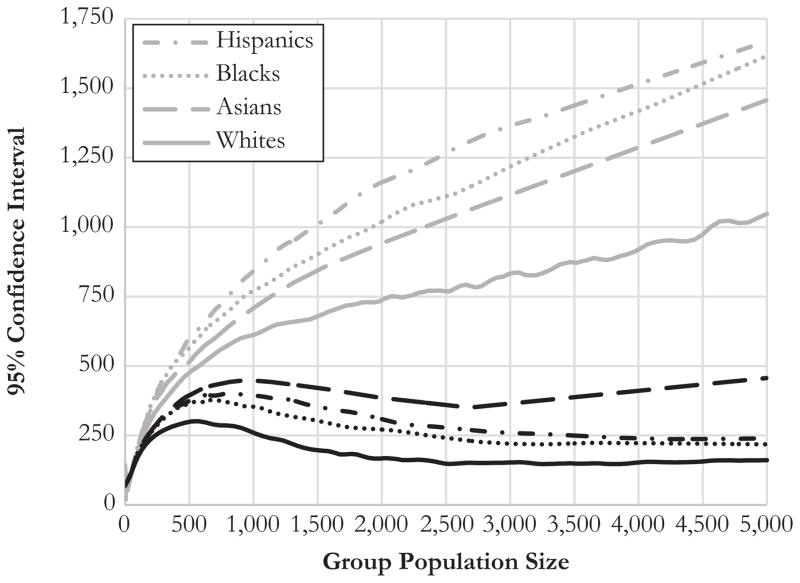
Fig. 1.
LOESS curves for the tract 95 % CIs by group population size using the 2005–2009 ACS population estimates with CIs computed using ACS MOEs (gray lines) and Census 2000 SF3 instructions (black lines). Groups are plotted with the same type of line (e.g., unbroken, long dash, and so on) for both data sets

