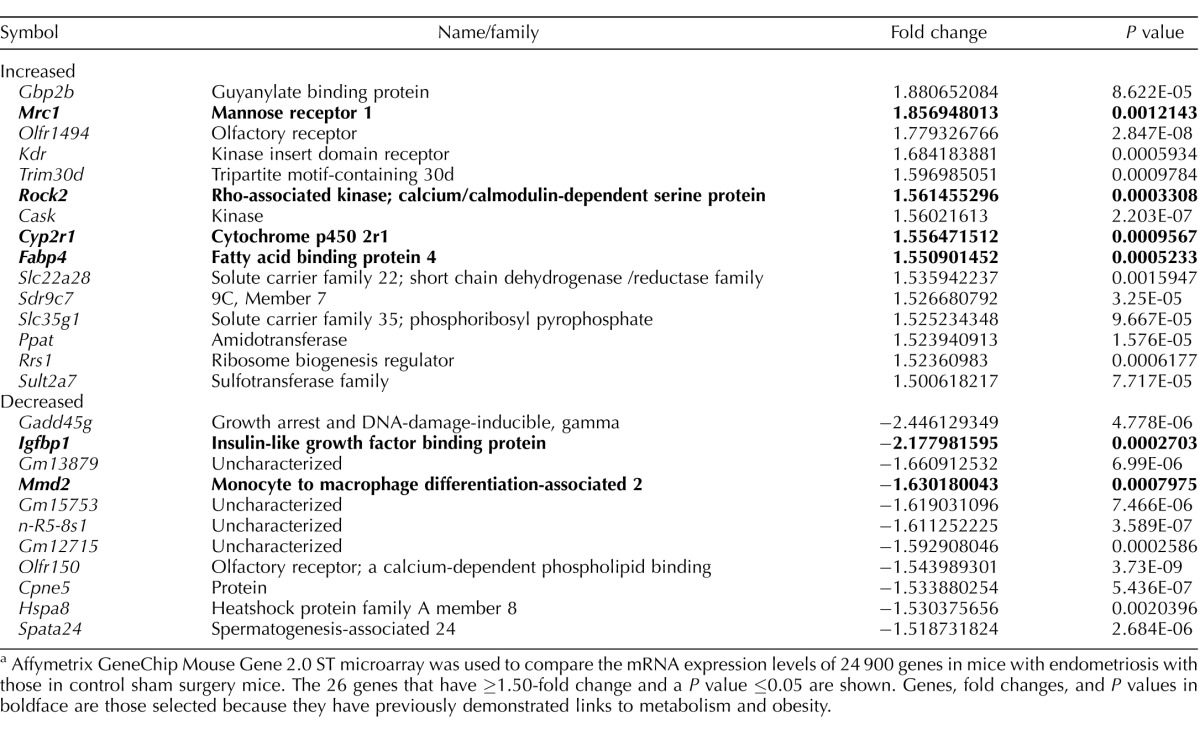
TABLE 2.
Gene selection from microarrays.a
Affymetrix GeneChip Mouse Gene 2.0 ST microarray was used to compare the mRNA expression levels of 24 900 genes in mice with endometriosis with those in control sham surgery mice. The 26 genes that have ≥1.50-fold change and a P value ≤0.05 are shown. Genes, fold changes, and P values in boldface are those selected because they have previously demonstrated links to metabolism and obesity.

