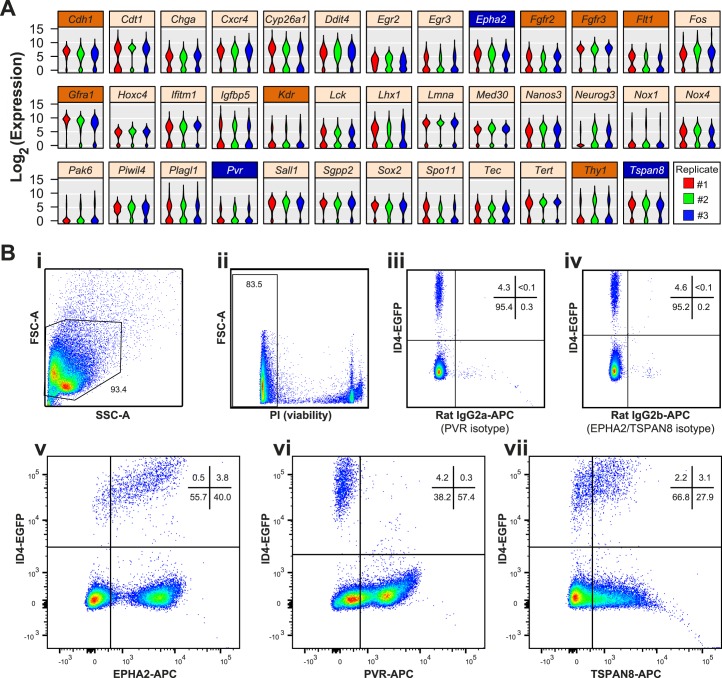
FIG. 1.
Bimodal mRNA abundance predicts subpopulations of P6 ID4-EGFP+ undifferentiated spermatogonia. A) Violin plots depict bimodal patterns of mRNA abundance among individual P6 ID4-EGFP spermatogonia based on single-cell qRT-PCR analyses (data are from [11]; the original publication details examples of genes not exhibiting bimodal abundance [e.g., Ddx4, Dazl, Itga6, Zbtb16]). Each violin is a histogram that shows log2-transformed Ct values for each replicate cell preparation (three violins per gene), where width (x-axis) at each expression level (y-axis) is indicative of the relative proportion of cells with that degree of mRNA abundance. Shown are results from 38 genes (from a total of 189 examined) that exhibited this bimodal pattern of mRNA abundance. Of the 10 bimodal genes encoding cell surface proteins, 7 (orange label bars) lacked suitable antibodies for flow cytometry or had already been investigated (e.g., GFRA1, THY1), but robust antibodies were available for the proteins encoded by Epha2, Pvr, and Tspan8 (blue label bars). B) Flow cytometry was used to characterize antibody staining for EPHA2, PVR, and TSPAN8 among testis cells from P6 Id4-eGfp mice. Density dot plots show sequential cell pregating: cells were selected based on light scatter characteristics (FSC-A × SSC-A; i) and viability (propidium iodide negative; ii). iii and iv) 4%–5% of viable single cells exhibited positive EGFP+ epifluorescence (compared with Id4-eGfp-negative littermates, not shown). EGFP+ spermatogonia exhibited either minimal background staining with isotype control antibodies (iii and iv) or abundant positive staining with antibodies against EPHA2 (v), PVR (vi), or TSPAN8 (vii). Dots denote individual cells and blue-to-red coloring scale is indicative of increasing cell number/density. The proportion of cells in gates and quadrants are noted.

