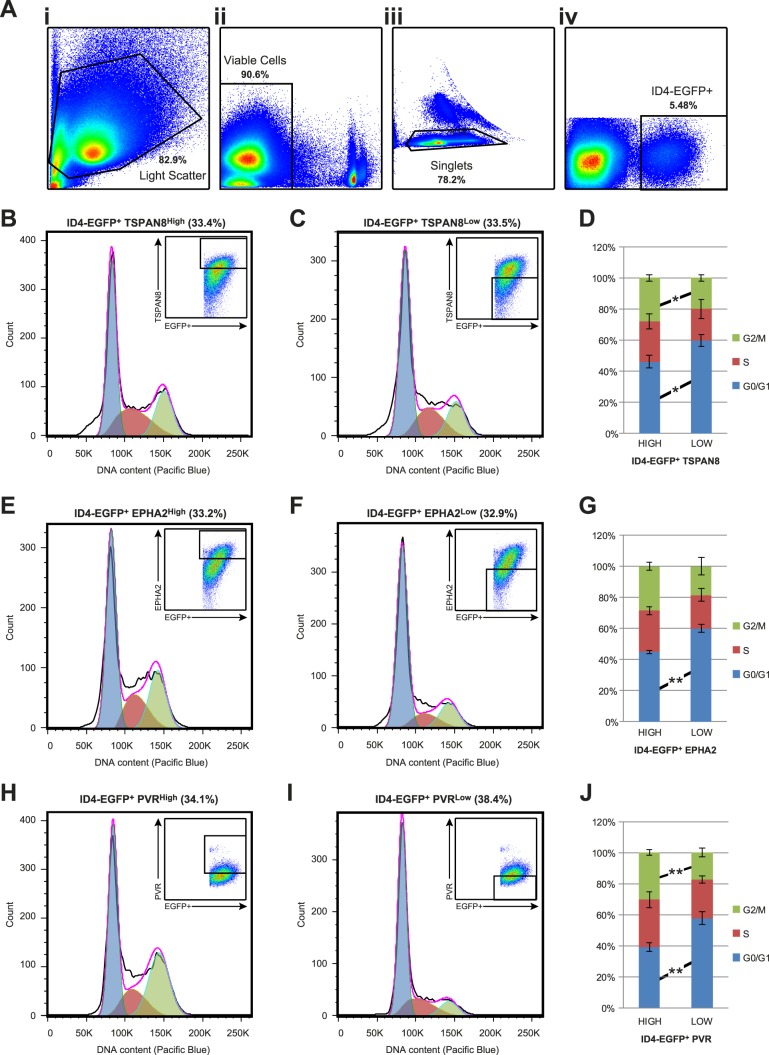
FIG. 2.
Cell cycle state of ID4-EGFP+ spermatogonial subpopulations. A) Cell cycle state among P6 ID4-EGFP+ subpopulations was characterized using flow cytometry and density dot plots demonstrate sequential cell pregating based on: light scatter characteristics (FSC-A × SSC-A; i), viability (propidium iodide negative; ii), single cells (iii), and ID4-EGFP+ (iv). Cells stained with antibodies against TSPAN8 (B–D), EHPA2 (E–G), and PVR (H–J) were used for DNA content analysis with the Vybrant DyeCycle Violet Stain. Histograms indicating cell number (y-axis) and DNA content (x-axis) are shown for EGFP+ spermatogonia with the top one-third (based on cell number) most intensely stained cells (B, E, and H) and marker-positive cells with the bottom one-third (based on cell number) weakest positive staining intensity (C, F, and I). Insets in each panel show dot plots with EGFP intensity, antibody staining intensity, and selection gates for histograms. The percentage of ID4-EGFP+ cells shown in each histogram is noted above the histogram. Transparent blue, red, and green curves in each histogram show the Gaussian functions corresponding to 2N (G1/G0), 4 > N > 2 (S), and (4N) G2/M fractions of each population, which serve as estimates of the proportion of gated cells in each cell cycle phase. D, G, and J) Mean ± SEM from results of four replicate staining experiments for each marker are shown in the stacked bar graphs. In each graph, significant differences in cell cycle state between subpopulations were determined by Student t-tests and are noted between bars (*P < 0.05; **P < 0.01).

