. 2017 Feb 17;3(2):e1601945. doi: 10.1126/sciadv.1601945
Copyright © 2017, The Authors
This is an open-access article distributed under the terms of the Creative Commons Attribution-NonCommercial license, which permits use, distribution, and reproduction in any medium, so long as the resultant use is not for commercial advantage and provided the original work is properly cited.
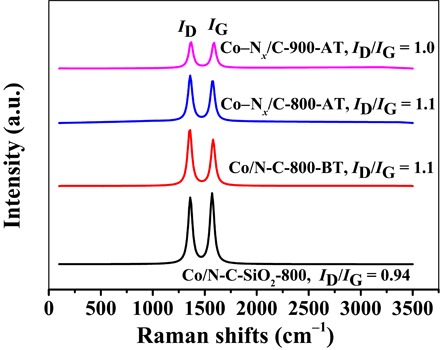
Fig. 4. Raman spectra of the samples.