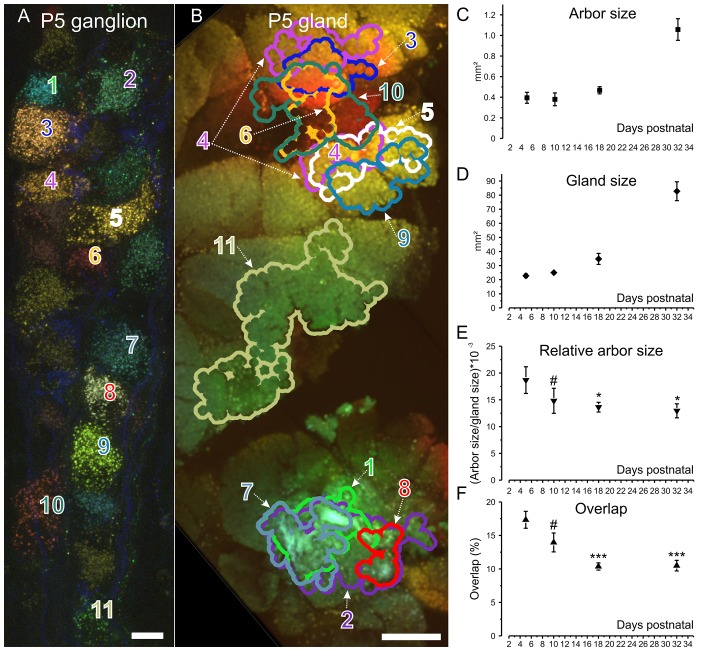
Figure 5. Retrograde labeling technique corroborates pruning and shows progressive segregation postganglionic parasympathetic axon arbors.
(A) Ganglion cells in a P5 submandibular ganglion that were retrogradely labeled following injection of 4 different colored fluorescent labels into nearby regions of the gland B. Scale bar = 10 µm. Eleven of these cells were analyzed (B) Based on the color of the retrogradely labeled vesicles, the axonal arbor projections of the eleven cells in panel A are shown. Some arbors that appear to overlap in this two-dimensional projection, do not overlap in the full three-dimensional image. Scale bar = 500 µm. (C) Average axon arbor area at four postnatal developmental ages. (D) The average gland area at four postnatal developmental ages. (E) The relative arbor sizes normalized to gland sizes demonstrate a significant drop in the area between p5 compared to p18 and p32. However, there was no significant change between P10 and older ages indicating that axon arbors stop decreasing in size after P10. One way ANOVA; n = 192 neurons. (F) Arbors also are significantly more overlapped in early life and become less so after P10. One way ANOVA; n = 2213 pairs. *= p<0.05; *** = p<0.001. Arbor overlap is not associated with the position of the cell bodies. For example, cells 6 and 10 overlap extensively in the gland, but their cell bodies are not adjacent (A and B). Conversely adjacent cells often project to non-overlapping areas (cell 8 and 9 in A and their projects in B).

