. 2017 Feb 3;6:e22472. doi: 10.7554/eLife.22472

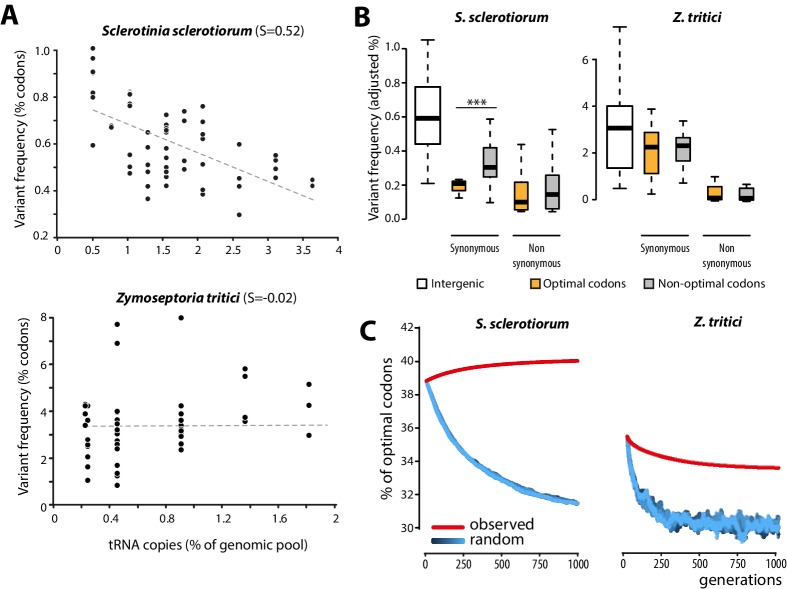
Figure 4. Biased synonymous substitution patterns underpin codon optimization in local populations of a generalist but not a specialist fungal parasite.

(A) Genome-wide frequencies of variant codons in local populations of the host generalist Sclerotinia sclerotiorum and the host specialist Zymoseptoria tritici, according to the number of genomic copies of cognate tRNAs. The number of cognate tRNAs for each codon type was determined using wobble rules for codon-anticodon pairing. Dotted lines show linear regression of the data (Z. tritici: Pearson ρ = 0.06; p=0.62; S. sclerotiorum ρ = −0.60; p=4.6 10−07). (B) Adjusted variant frequencies for intergenic nucleotide triplets, optimal and non-optimal codons. Synonymous and non-synonymous SNPs are shown separately. Differences between optimal and non-optimal codon rates were assessed by Welch’s t-test (***p<0.001). (C) Predicted evolution of genome-wide content in optimal codons in S. sclerotiorum and Z. tritici based on observed and random mutation patterns.

DOI: http://dx.doi.org/10.7554/eLife.22472.011

Figure 4—source data 1. Codon statistics for S. sclerotiorum and Z. tritici genomes.
DOI: 10.7554/eLife.22472.012
Figure 4—source data 2. Frequency of codon substitutions in S. sclerotiorum and Z. tritici populations (as % of all codons).
Ref. indicates codons in the reference genome (isolate 1980 for S. sclerotiorum and isolate IPO323 for Z. tritici) tog ether with their total number, Var. indicates variant codons.
elife-22472-fig4-data2.docx (126.7KB, docx)
DOI: 10.7554/eLife.22472.013
Figure 4—source code 1. Python scripts for in silico evolution of codon usage.
DOI: 10.7554/eLife.22472.014

Figure 4.

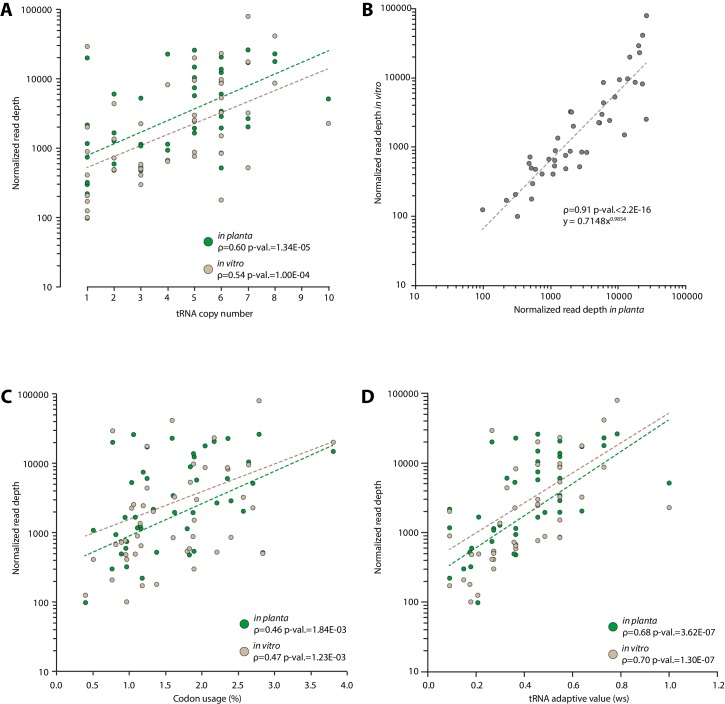
Figure 4—figure supplement 1. Experimental determination of S. sclerotiorum tRNA accumulation supports a good correlation between genomic copy numbers and tRNA accumulation.

Figure 4—figure supplement 1.

The accumulation of tRNA transcripts was determined by sequencing small RNAs of S. sclerotiorum grown in vitro and in planta. (A) Normalized read depth correlated exponentially with tRNA copy number for each tRNA species both in vitro and in planta. (B) A comparison of tRNA transcripts accumulation in vitro and in planta. Correlation of tRNA transcripts accumulation with codon usage (C) and tRNA adaptive value (D) calculated as described in dos Reis et al. (2004). The exponential regression of the data is shown as a dotted line. The Spearman rank correlation coefficient ρ and the p-value for Spearman’s test are given.
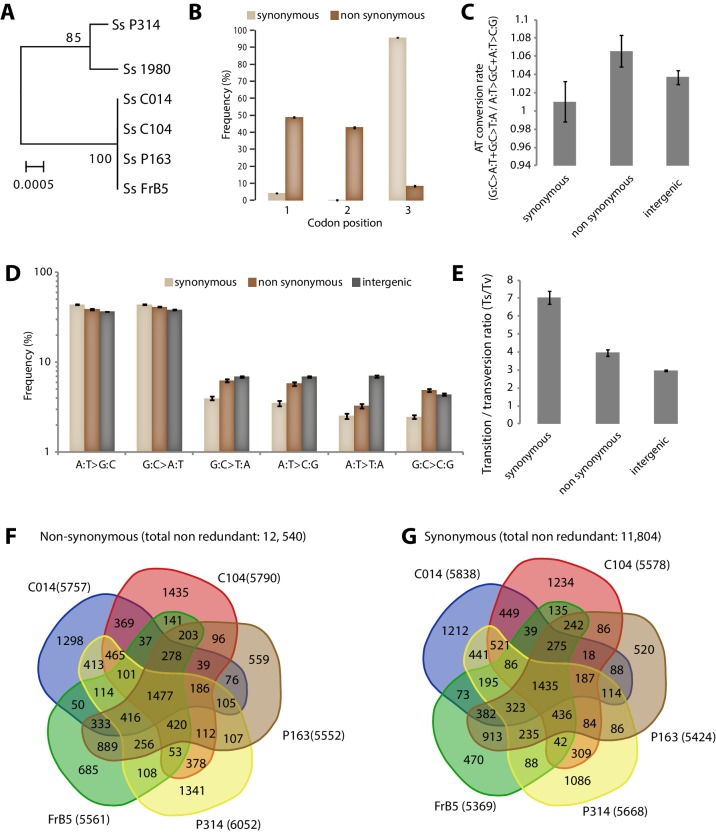
Figure 4—figure supplement 2. Analysis of Single Nucleotide Polymorphisms (SNPs) in a natural population of the generalist plant pathogen Sclerotinia sclerotiorum.

Figure 4—figure supplement 2.

(A) IGS-based phylogeny of the S. sclerotiorum isolates re-sequenced in this work. (B) Frequency of SNPs according to codon position and SNP type. (C) SNPs in coding regions do not show significant bias toward enrichment in A or T nucleotides as shown by the rate of AT conversion. (D) Frequency of each substitution type among synonymous, non-synonymous and intergenic SNPs shows higher transition rate among synonymous substitutions. (E) Transition/transversion ratio per SNP type shows ~threefold increase in synonymous substitutions. (B–E) Error bars show the standard deviation of means for each isolate. Distribution of non-synonymous (F) and synonymous (G) SNPs among the five re-sequenced isolates.