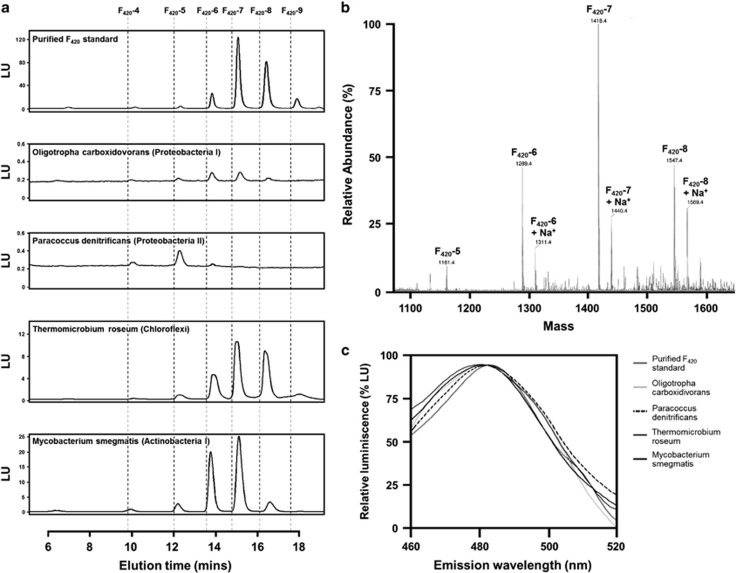
Figure 3.
Chemical detection of F420 in dominant soil phyla. (a) HPLC traces showing F420 from cell lysates of different species relative to a purified F420 standard. The traces show the intensity of the fluorescence emitted (λexcitation=420 nm, λemission=480 nm). The dotted lines show the times at which each species started to elute. (b) Mass spectra confirming the molecular weight and oligoglutamate side chain length of the purified F420 standard. (c) Fluorescence emission spectra of F420 from cell lysates of five different species against a purified F420 standard.

