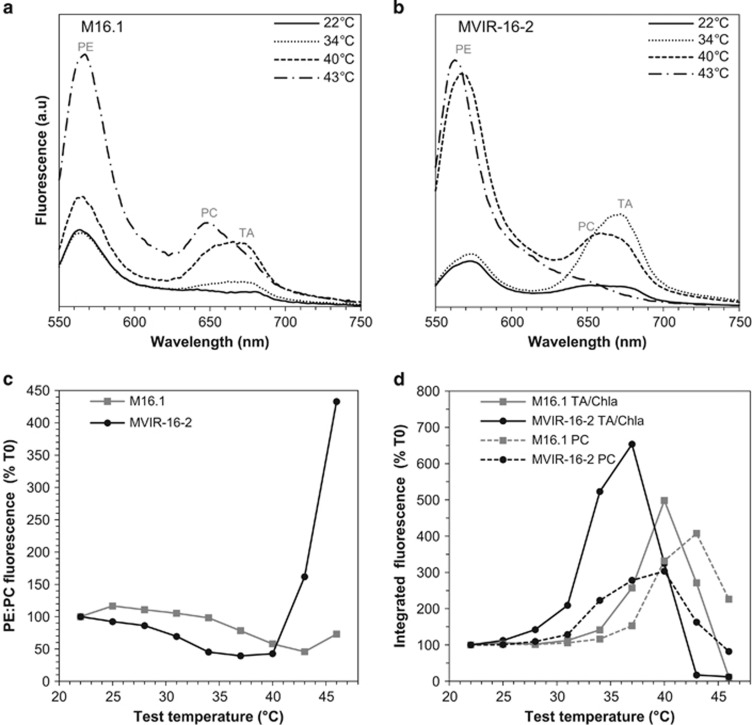
Figure 2.
Examples of variations of the fluorescence emission spectra (with excitation at 530 nm) for the tropical Synechococcus strain M16.1 and the subpolar strain MVIR-16-2 acclimated at 22 °C and submitted to a progressive temperature increase. Fluorescence emission spectra of M16.1 (a) and MVIR-16-2 (b) strains at different temperatures. (c) Variations of the PE:PC (570:650 nm) fluorescence emission ratio during the course of temperature increase in both strains, expressed as percentage of the initial value (at 22 °C). (d) Relative variations of fluorescence intensity expressed as percentage of the initial fluorescence value, after spectral decomposition of the two red components: phycocyanin at 650 nm (dashed line) and terminal acceptor at 680 nm (solid line). Note that the APC fluorescence component of the 680 nm peak cannot be easily separated from that of RC chlorophylls in decomposed spectra but it is expected to be much lower.

