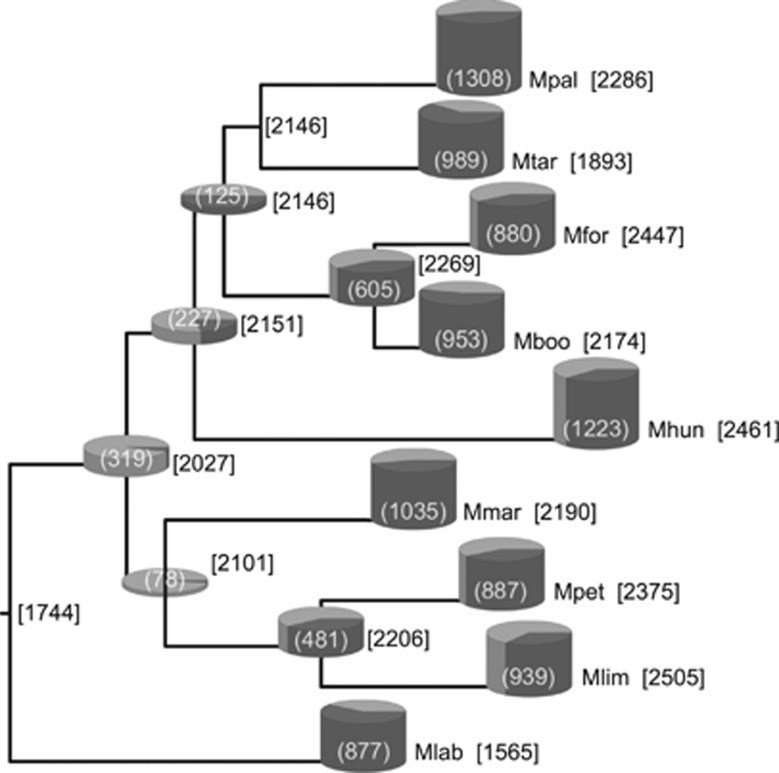
Figure 2.
Reconstruction of the ancestral genome content of the Methanomicrobiales. Numbers in square brackets indicate the protein cluster content of the adjacent node or extant species. The number presented in parentheses represents the combined gene gains and losses inferred to have occurred since the previous node. Gains (black portion) and losses (white portions) are proportionally scaled in cylinders. The absence of a cylinder indicates that <0.5 gains plus losses were inferred to have occurred. Abbreviations defined in Figure 1.

