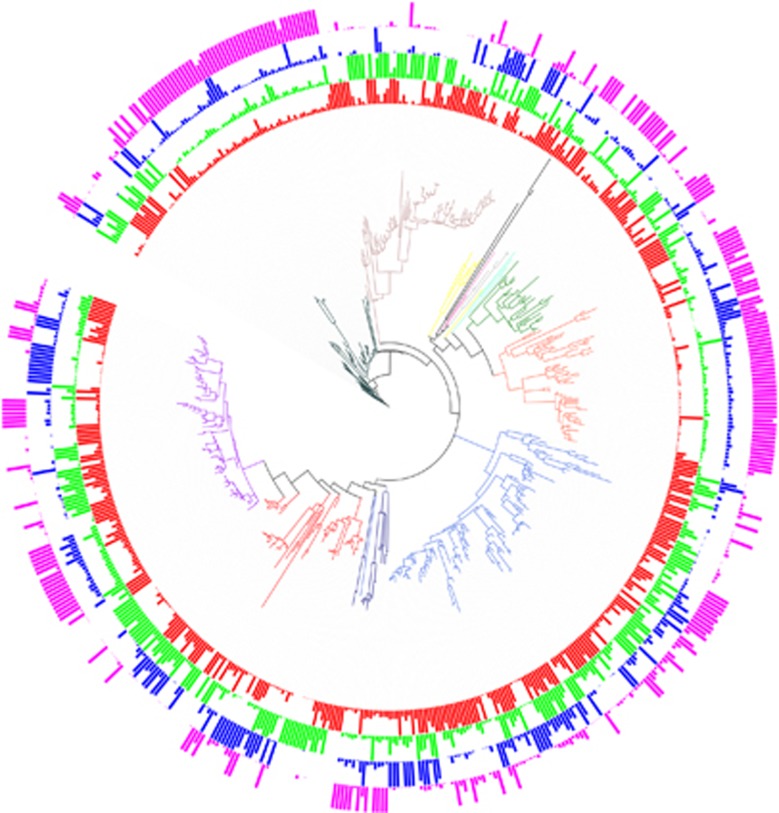
Figure 3.
Phylogenetic placement and relative abundance of 16S rRNA OTUs at four different dilution levels across soil communities A and B. Relative abundance at the D1, D2, D3 and D4 dilution levels from both bacterial communities are represented by red, green, blue and pink plain circles, respectively. The relative abundance of each OTU has been normalized to the maximum abundance of this OTU across dilutions and is therefore bounded between 0 and 1. Branches are colored according to the phylum assignment of each OTU (Acidobacteria: yellow, Actinobacteria: orange red, Bacteroidetes: rosy brown, Chloroflexi: aquamarine, Firmicutes: dark green, Gemmatimonadetes: light green, Planctomycetes: black, α-proteobacteria: light blue, β-proteobacteria: purple, δ-proteobacteria: navy blue, γ-proteobacteria: red and Verrucomicrobia: gray). The online tool Interactive Tree of Life (iTOL) was used to prepare this figure (http://itol.embl.de/).

