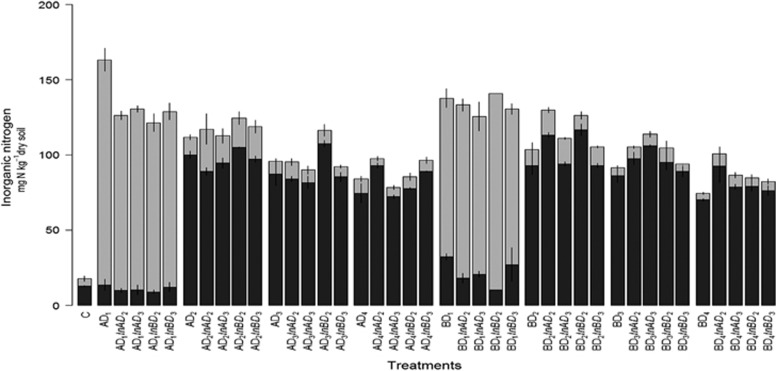
Figure 8.
Soil mineral nitrogen pool sizes in control and restored communities. Samples are labeled according to the following scheme: AD1InAD2 stands for microcosms established with Dilution 1 from soil A and inoculated with Dilution 2 from soil A. Dark gray indicates the NH4+ pool and light gray the NO3− pool. Means±s.d. of data are plotted.

