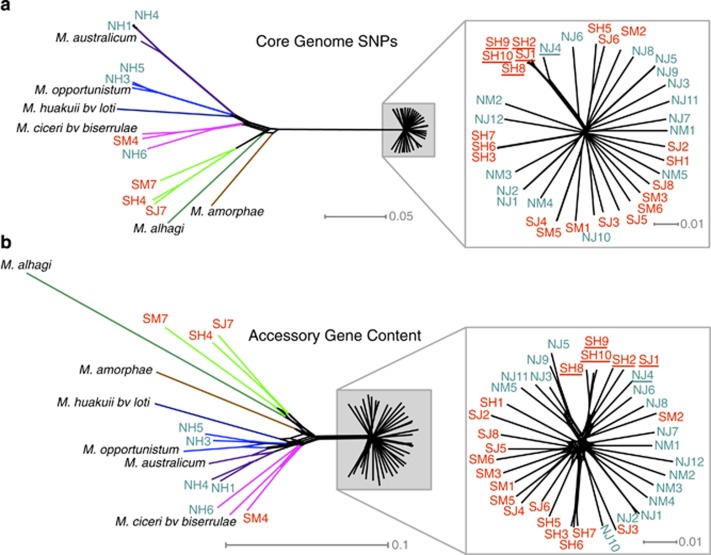
Figure 3.
NeighborNet diagrams of strain relatedness indicate the focal clade is genomically cohesive. (a) Relatedness based on SNPs in the core genome; scale bar indicates SNP divergence, scaled by the number of SNPs per bp of aligned core genome. (b) Relatedness based on variation in accessory gene content; scale bar indicates divergence of accessory gene presence/absence. Zoomed region depicts the focal clade (teal: serpentine soil origin; red: non-serpentine soil origin). Strains fully assigned to the minority STRUCTURE subgroup within the focal clade are underlined. Non-focal clades are color-coded for ease of comparison.

