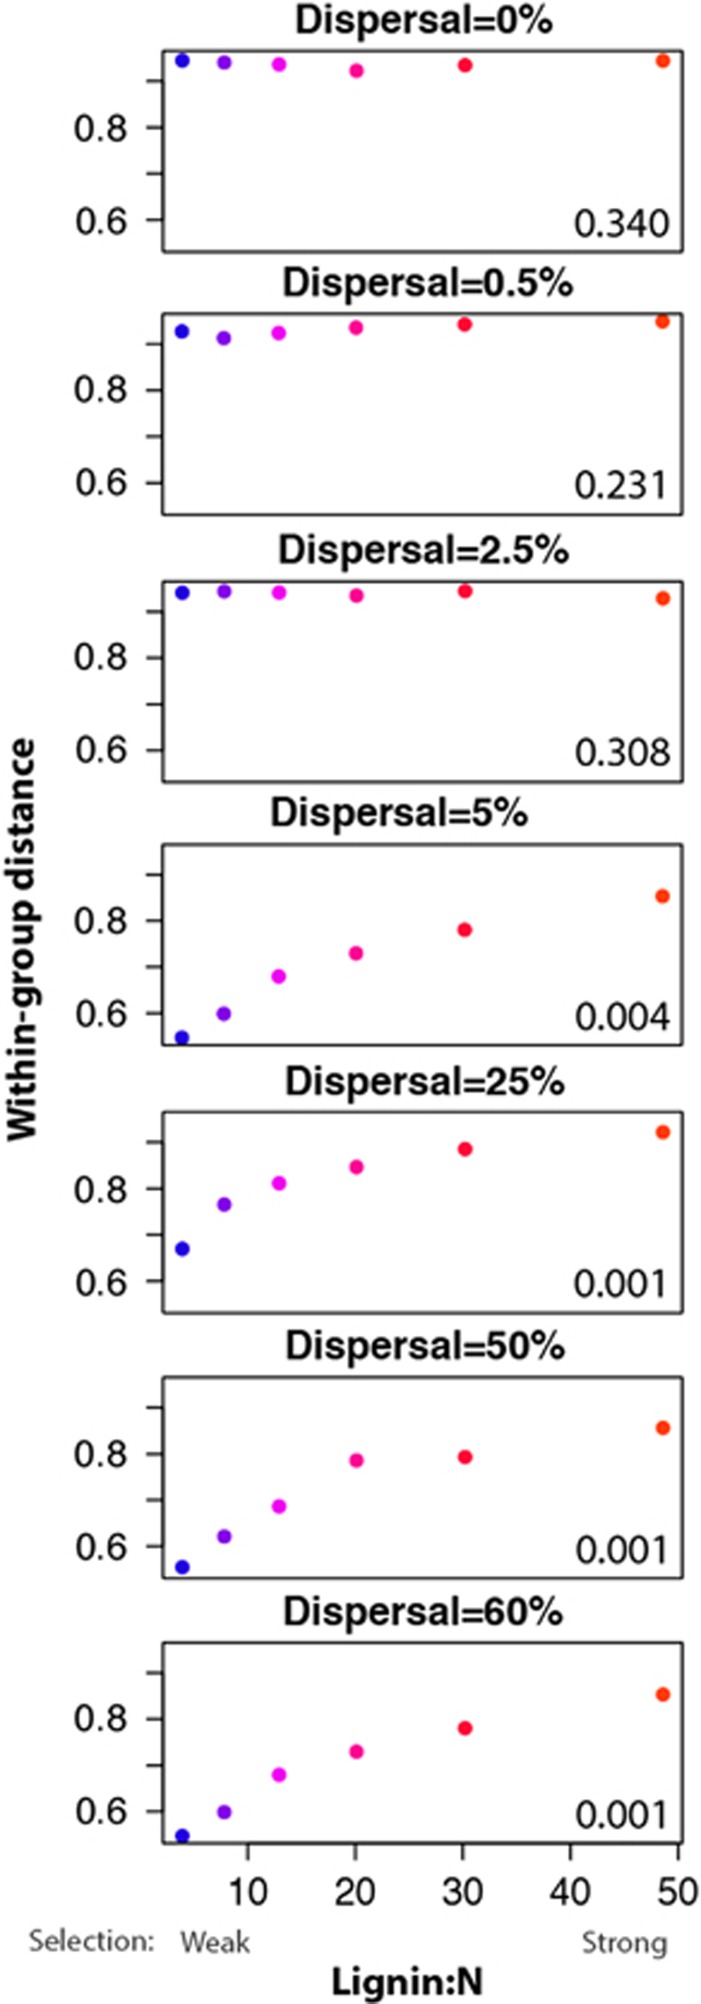
Figure 5.
Within-group distance (1−Bray–Curtis similarity) of replicate communities within lignin/N treatments (x axis) that were exposed to different dispersal rates for 6 years (panels). Lignin/N levels are shaded from blue (lowest) to orange (highest), corresponding to previous color codes. The bottom right of each panel shows P-values for the null hypothesis that within-group distances across lignin/N treatments are equal in a single dispersal level. Note the x axis is across lignin/N, not over time or dispersal level (but see Supplementary Figure S3), and that low lignin/N corresponds to high substrate quality and weaker selection.

