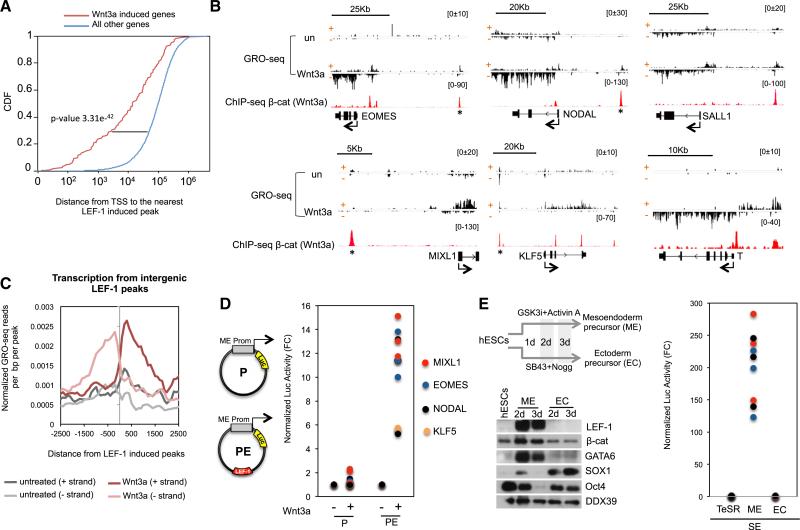
Figure 3. GRO-seq Analysis of Wnt3a-Induced Genes in hESCs.
(A) Cumulative distribution frequency of LEF-1 activated peaks in Wnt3a regulated genes and all the other genes in hESCs.
(B) Examples of GRO-seq profiles in untreated and Wnt3a-treated H1 hESCs (200 ng/ml, 6 hr). Sense (+) and antisense (−) DNA strands are depicted. Scale bars are shown above the GRO-seq profiles. The β-catenin peaks mark potential nearby gene enhancers.
(C) Metaprofile of nascent transcription from LEF-1 activated enhancers (eRNAs) in untreated and Wnt3a stimulated hESCs.
(D) The activity of the EOMES, MIXL1, NODAL, and KLF5 promoter region was assessed alone (P, see plasmid graph), or together with a LEF-1 enhancer (*; PE) in transfection assays with a luciferase reporter. The graph plots luciferase activity normalized to Renilla (from three independent replicates in untreated (−) or Wnt3a (+)-treated hESCs (200 ng/ml, 9 hr).
(E) Immunoblot showing LEF-1 and β-catenin protein levels in hESCs, mesendodermal (ME) cells, and ectodermal (EC) precursor cells. Specific markers for hESCs (OCT4), ME cells (GATA6), and EC cells (SOX1) are shown. The DDX39 blot was used as a loading control. A diagram of the protocol used for EM and EC differentiation (days: 2 days, 3 days) is shown at the top. The graph depicts normalized luciferase activity from three independent replicates of the PE constructs (from part D) in the ME and EC precursor cells.
See also Figure S3.

