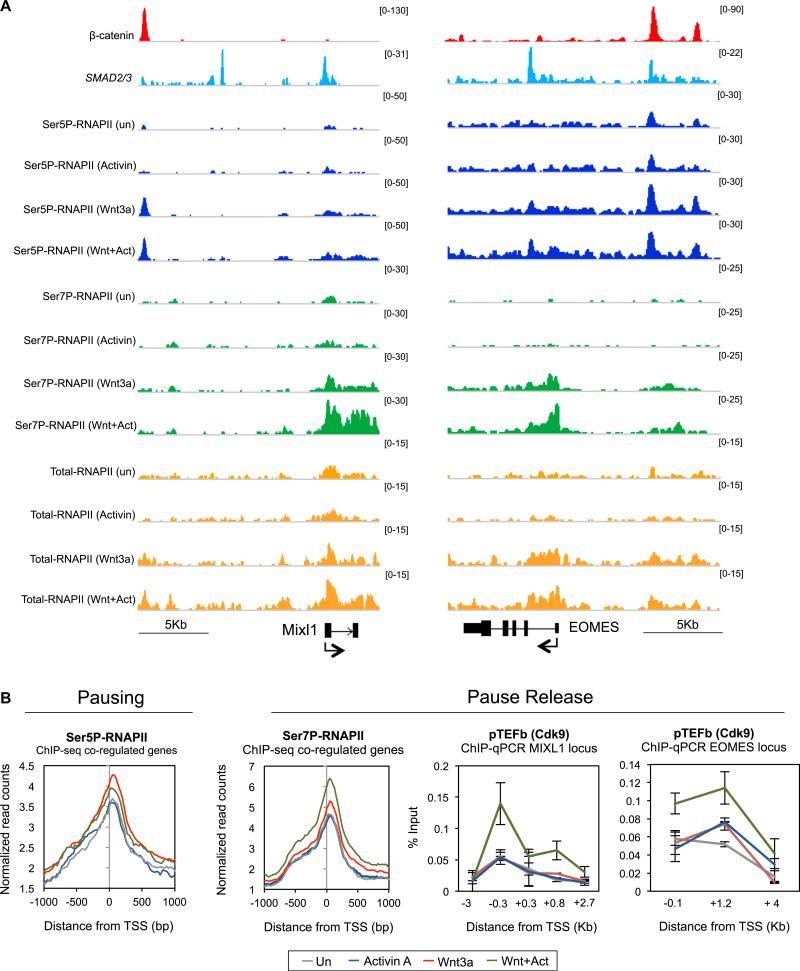
Figure 6. Activin/SMAD2,3 Signaling Stimulates P-TEFb Elongation at ME Genes.
(A) ChIP-seq binding profile of the indicated proteins (left) in untreated, Wnt3a (200 ng/ml)-, Activin A (100 ng/ml)-, or Wnt3a plus Activin A (W200A100)-treated hESCs (4 hr). Gene diagram and scale bar are depicted at the bottom.
(B) Left, ChIP-seq metaprofile for Ser5P- and Ser7P-RNAPII within 1 Kb of the TSS for the 189 Wnt-Activin coregulated genes. Right, ChIP-qPCR analysis of P-TEFb/CDK9 levels at the MIXL1 and EOMES genes in response to signaling, as indicated. Mean (SD; n = 2–3).
See also Figure S6.

