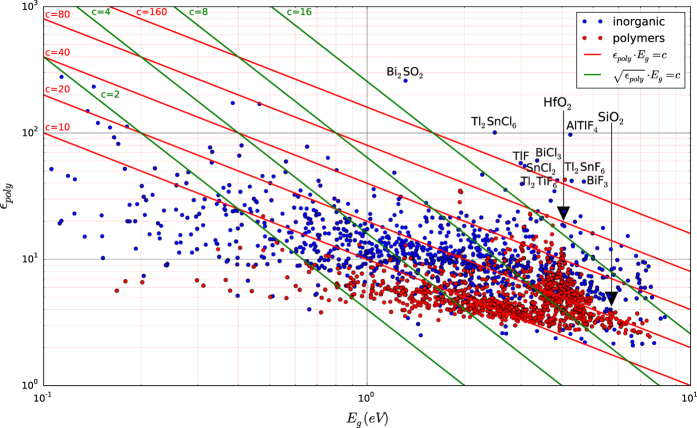
Figure 4. The polycrystalline estimate of the dielectric constant .
The x-axis represents the DFT-GGA+U band gap values (Eg) obtained from the Materials Project website. There is a total of 1,056 data points for inorganic compounds. The red data points refer to values for polymers calculated by Huan et al.31 Red and green lines represent the figures of merit and respectively. The formulas of promising compounds with and , are shown on the graph. HfO2, SiO2 and polyethylene are also shown for information.

