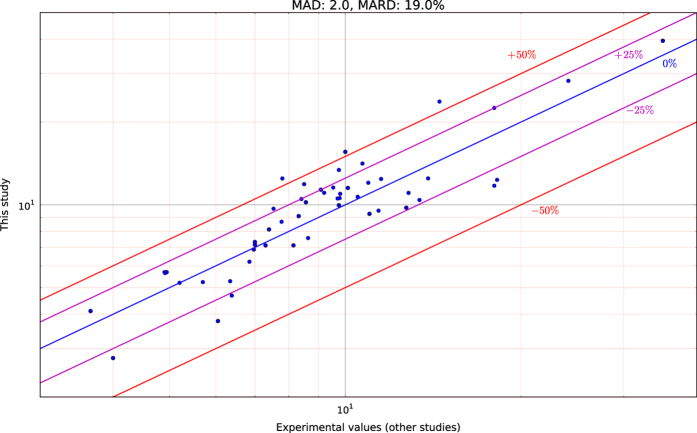
Figure 7. Comparison of calculated values.
versus experimental values in the literature. The lines indicate the relative deviation of the calculated values with respect to experiments. The Mean Absolute Deviation (MAD) and Mean Absolute Relative Deviation (MARD) were extracted as 2.0 and 19.0% respectively. Data points are listed in Table 4.

