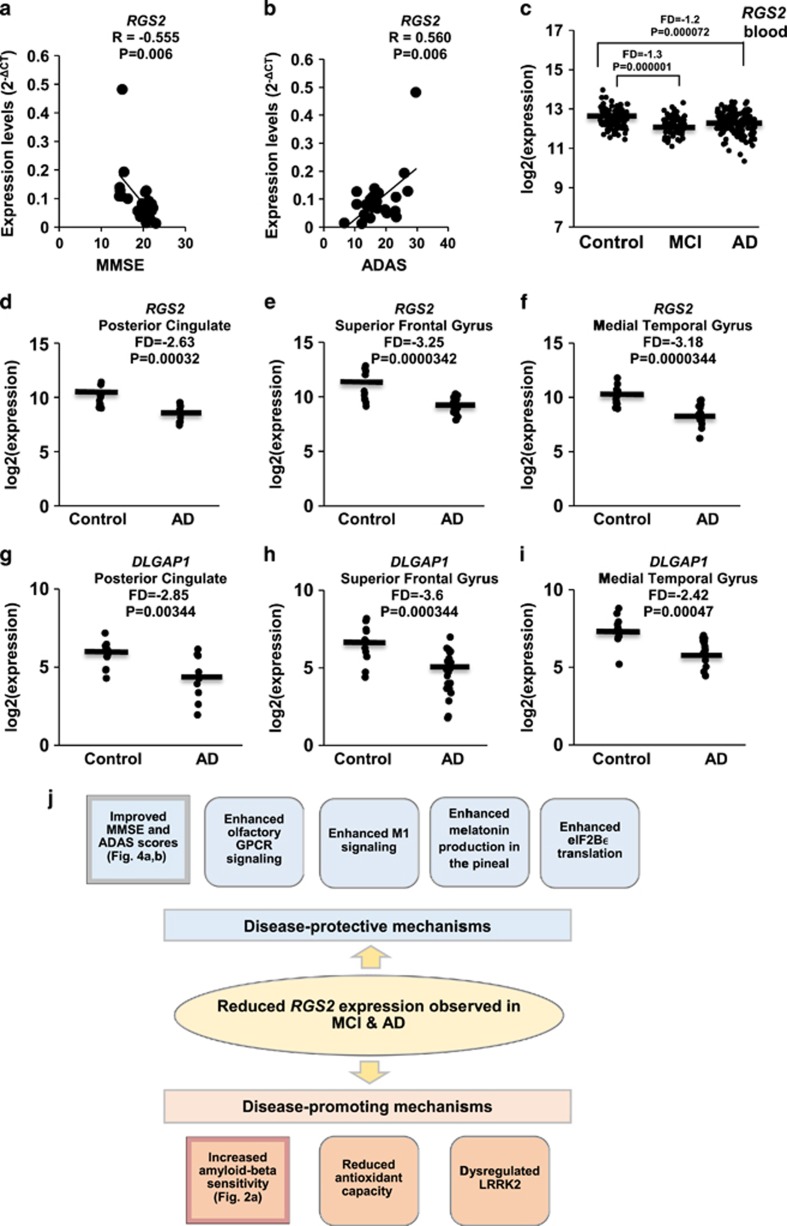
Figure 4.
(a and b) Correlations between the expression levels of RGS2 in lymphoblastoid cells lines (LCLs) from 23 individual Alzheimer's disease (AD) patients (Mini Mental State Examination (MMSE) <24) and their cognitive test scores as determined at the time of blood withdrawal for LCL generation. Note that higher MMSE scores reflect better cognition, whereas it is the opposite for Alzheimer's Disease Assessment Scale (ADAS) scores (a) MMSE: a negative correlation of R=−0.555 (P=0.006) was observed (b) ADAS: a positive correlation of R=0.560 (P=0.006) was observed. Note: MMSE<24 scores were determined for 23 out of 28 AD patients (Supplementary Table 2). (c) Expression levels of RGS2 in 80 mild cognitive impairment (MCI), 104 healthy controls and 145 AD patients from whole blood (Data set GSE63060) (d–i) Expression levels of RGS2 and DLGAP1 in postmortem brains (Data set GSE5281) from AD patients and age-matched non-demented controls. (d and g) Posterior cingulate: AD (N=9) and control (N=13). (e and h) Superior frontal gyrus: AD (N=23) and control (N=11). (f and i) Medial temporal gyrus: AD (N=16) and control (N=12). (j) A scheme summarizing tentative disease-protective and disease-promoting events associated with reduced RGS2 expression in AD brain tissues. Squares on the left summarize our observations; adjacent squares summarize tentative related consquences (see the 'Discussion' section).

