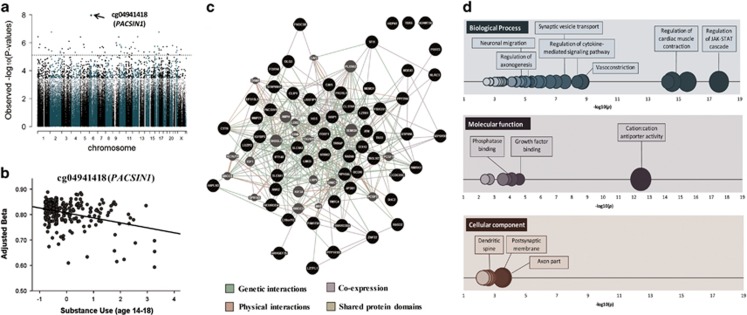
Figure 1.
Differentially methylated loci at birth associated with adolescent substance use. (a) Manhattan plot showing genome-wide associations between DNA methylation at birth and later substance use (age 14–18). The dotted line represents the false discovery rate (FDR)-correction threshold (i.e., loci above the line are considered significant). (b) Prospective association between the top differentially methylated locus at birth and later substance use. The X axis shows substance use factor scores, whereas the Y axis represents beta methylation values, adjusted for sex and cell-type proportions. (c) Gene network analysis using GeneMANIA. Black circles represent genes (n=60) associated with the 65 probes found to be related to adolescent substance use in the genome-wide analysis at birth. Gray circles represent additional genes predicted by GeneMANIA based on genetic and physical interactions, shared protein domains as well as protein co-expression data. The gene network analysis demonstrates that, rather than being isolated, these genes clustered into a complex interconnected network. (d) Significantly enriched biological processes (blue), molecular functions (purple) and cellular components (red), based on gene ontology (GO) analysis of 60 genes annotated to probes that predict substance use at birth (n=65; q<0.05). Circles represent GO terms that survive FDR correction and contain at least one gene. The X axis represents −log(10) P-values. The opacity of the circles indicates level of significance (darker=more significant). The size of the circles indicates the percentage of genes in our results for a given pathway compared with the total number of genes in the same pathway (i.e., larger size=larger %).

