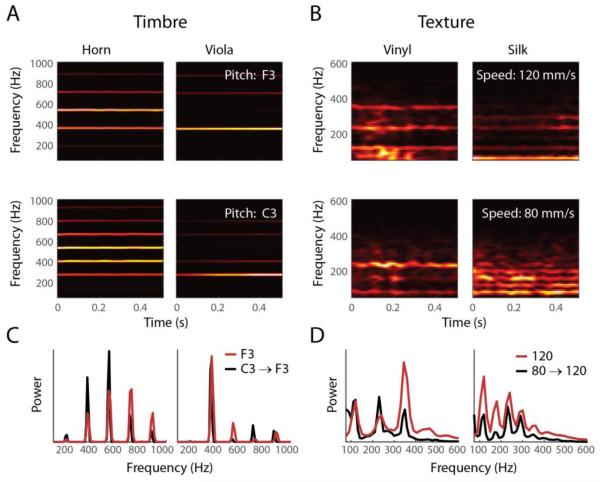
Figure 4. Auditory timbre and tactile texture.
A∣ Spectrograms of two tones (F3 and C3, different rows), played by two different instruments (horn and viola, different columns). B∣ Spectrograms of skin oscillations elicited by two different textures (vinyl and silk) when scanned at different speeds across the fingertip skin (80 and 120 mm/s). C,D∣ Time-averaged power spectra of sound waves (C) and skin vibrations (D) when correcting for fundamental frequency/scanning speed by shifting the spectra of the lower tone/speed (red trace) to the higher one (black trace). The general spectral composition is preserved across pitch/speed and can be used to resolve different instruments or textures. [Sound files were obtained from the University of Iowa Electronic Music Studios database, http://theremin.music.uiowa.edu]

