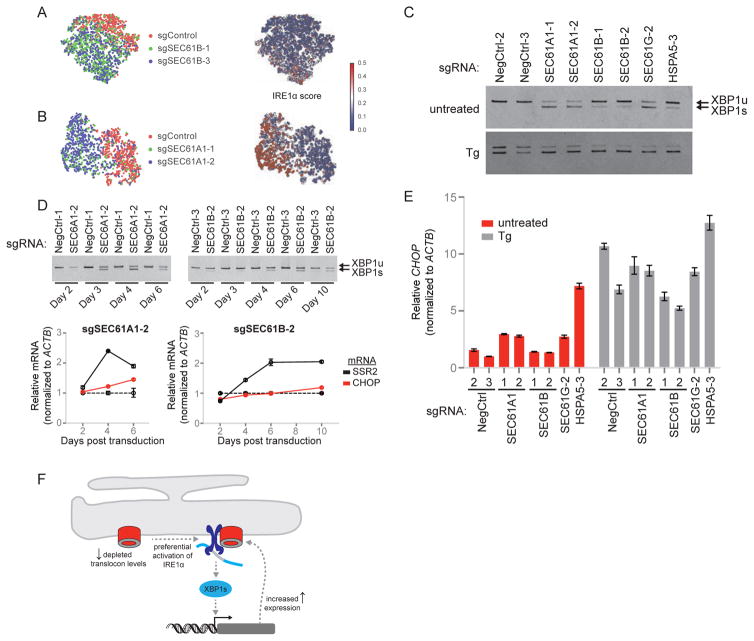
Figure 7. Translocon Gene Repression Preferentially Activates IRE1α UPR Signaling.
(A) Single-cell analysis of SEC61B-perturbed cells in UPR Perturb-seq experiment. Control cells contain the NegCtrl-3 guide.
(B) Analysis of SEC61A1-perturbed cells (as in A).
(C) XBP1 mRNA splicing from cells transduced with the indicated sgRNAs and treated ± thapsigargin (0.5 μM Tg for 1.5 hr).
(D) XBP1 mRNA splicing (top) and SSR2 and CHOP mRNA expression (bottom) from cells transduced with the indicated sgRNAs. Graphical data represent means relative to ACTB mRNA and normalized to cells transfected with NegCtrl-1 sgRNA (dotted lines) ± standard error of technical replicates (n = 3).
(E) Relative CHOP mRNA in cells described in (C). Data represent means relative to ACTB mRNA and normalized to cells transfected with NegCtrl-3 sgRNA ± standard error of technical replicates (n = 3).
(F) Model of translocon feedback signaling through IRE1α.
See also Figure S7.

