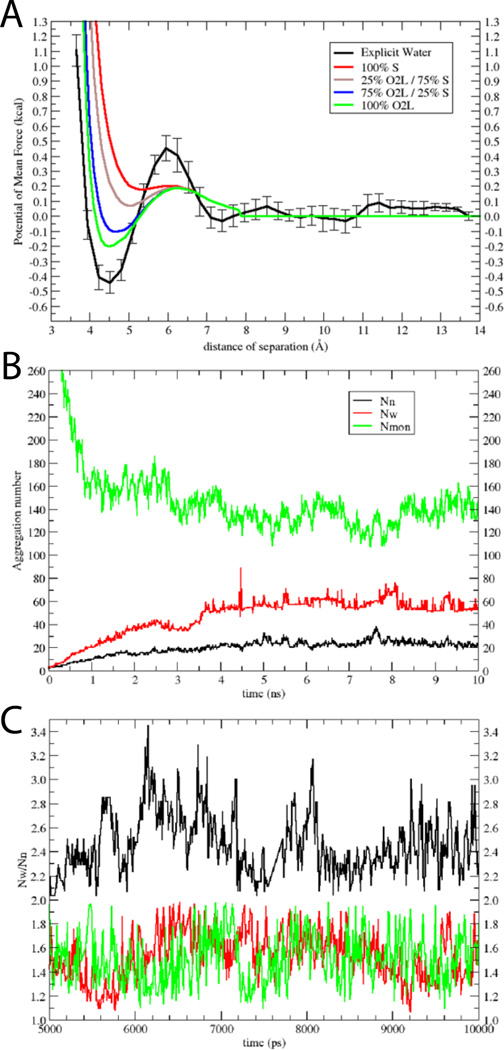
Figure 3.
Model for SDS: A) PMFs between two dimethyl sulfate ions in explicit water (black); error bars were obtained from four independent calculations. Also shown are results in implicit water, where the negative charge was distributed only on the S atom (red), 25% on the O2L atoms and 75% on the S atom (brown), 75 % on the O2L atoms and 25% on the S atom (blue), and only on the O2L atoms (green). B) Aggregation numbers (Nn black line, Nw red line), and number of monomers (Nmon green line) as a function of time for the 10-ns simulation of 1000 SDS molecules at 50 mM. C) Nw/Nn versus time for 50 mM (black), 200 mM (red) and 400 mM (green); only the converged last 5 ns are shown.

