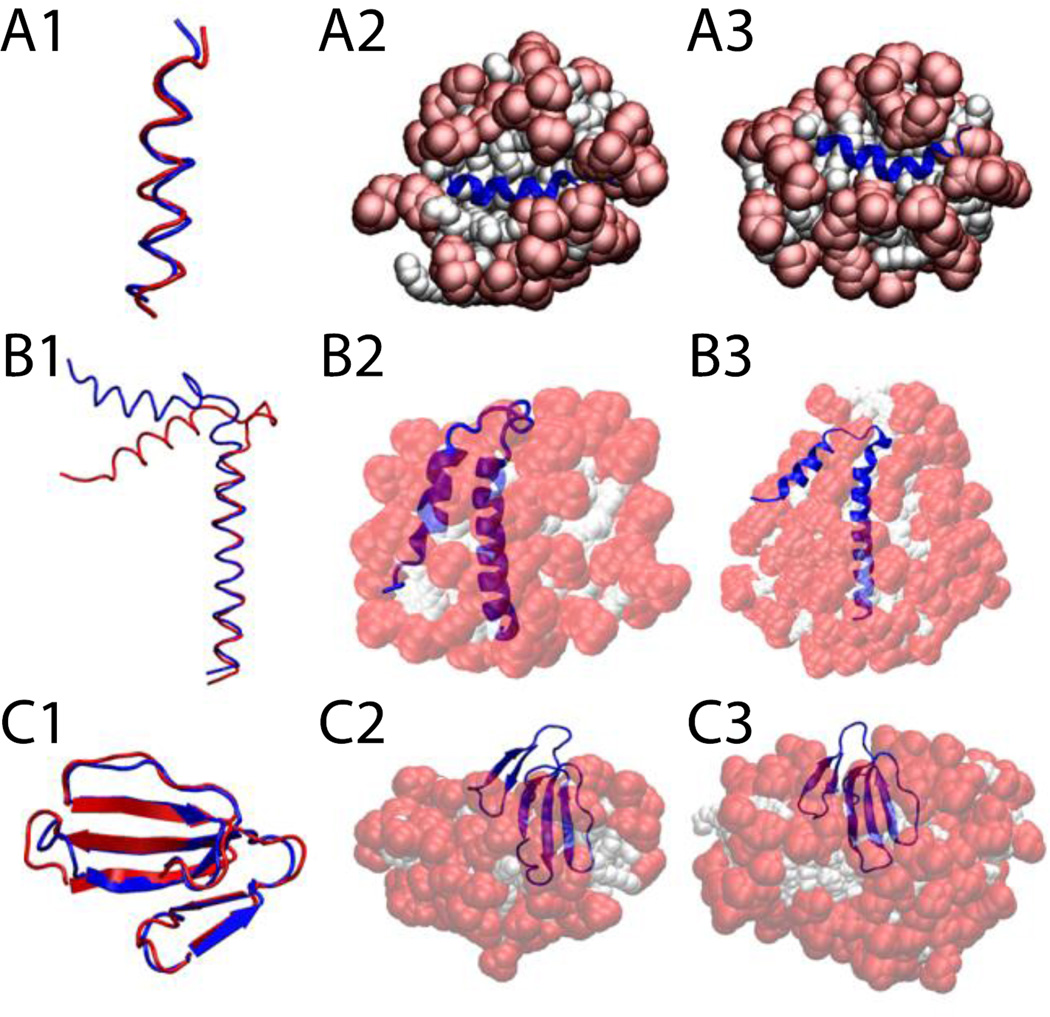
Figure 8.
Cartoon representation of HIV gp41 (A), Phospholamban (B), and P-type cardiotoxin (C) A1, B1, C1, comparison between the experimental structure (blue) versus last frame at 5 ns (red). A2, protein-micelle system after 1 ns with position restraints on the protein. B2, C2, protein-micelle system after 5 ns without restraints with a number of molecules close to the aggregation number. A3, protein-micelle system after 5 ns without restraints. B3, C3, protein-micelle system after 5 ns without restraints with a number of molecules close to twice the aggregation number.

