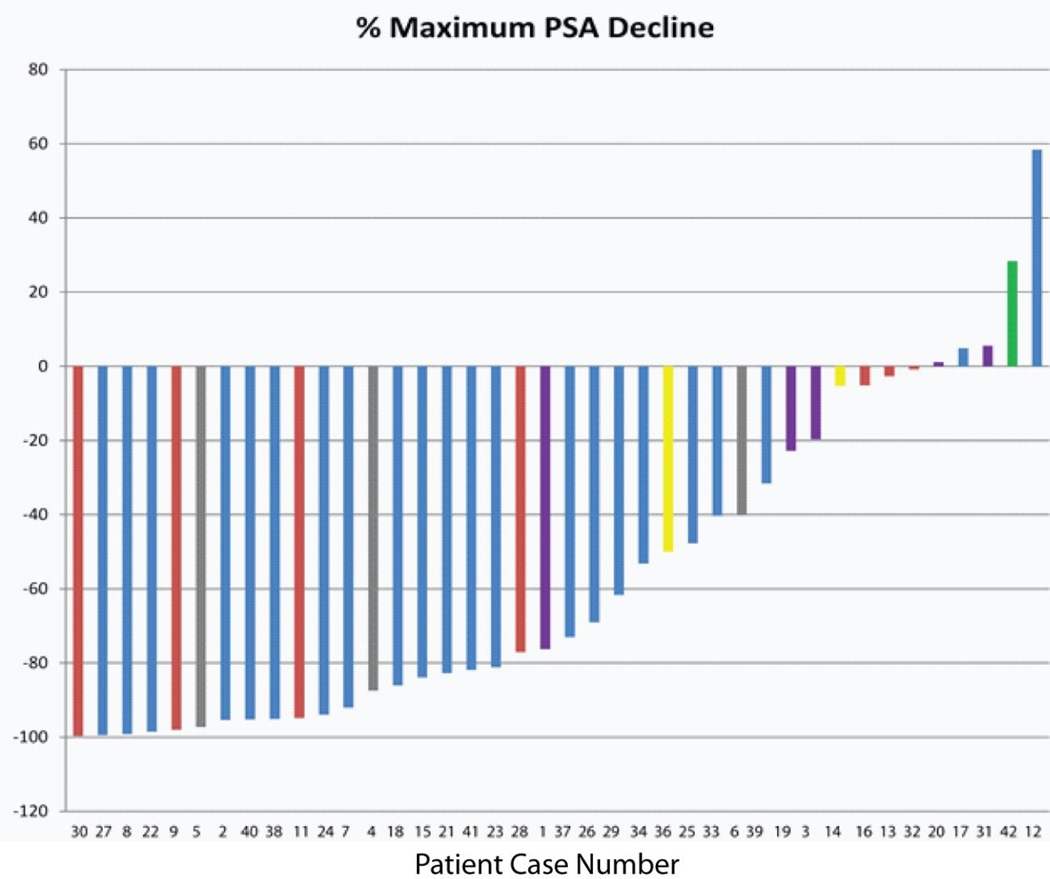
Figure 1.
Waterfall plot of best PSA response to therapy with abiraterone and dutasteride. Red bars indicate prior ketoconazole. Purple bars indicate prior chemotherapy. Gray bars indicate prior enzalutamide. Yellow bars indicate prior ketoconazole and chemotherapy. Green bar indicates prior ketoconazole and enzalutamide.

