
Figure 3.
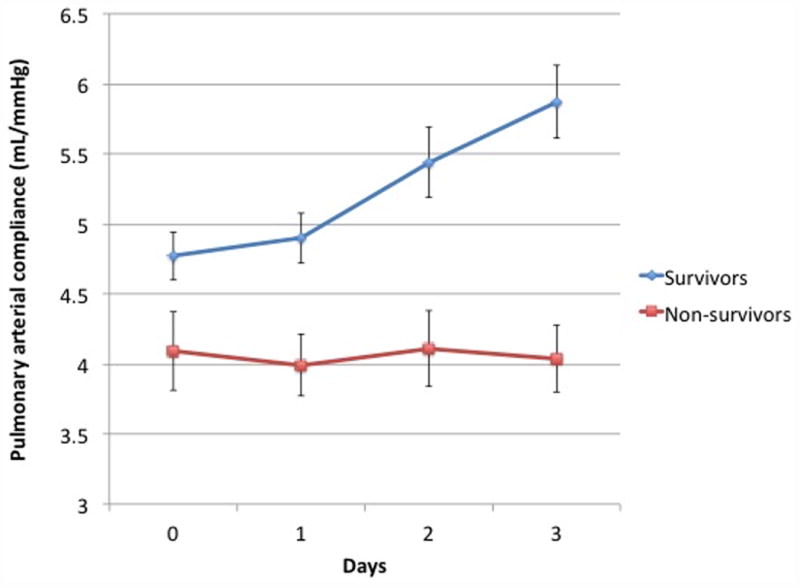
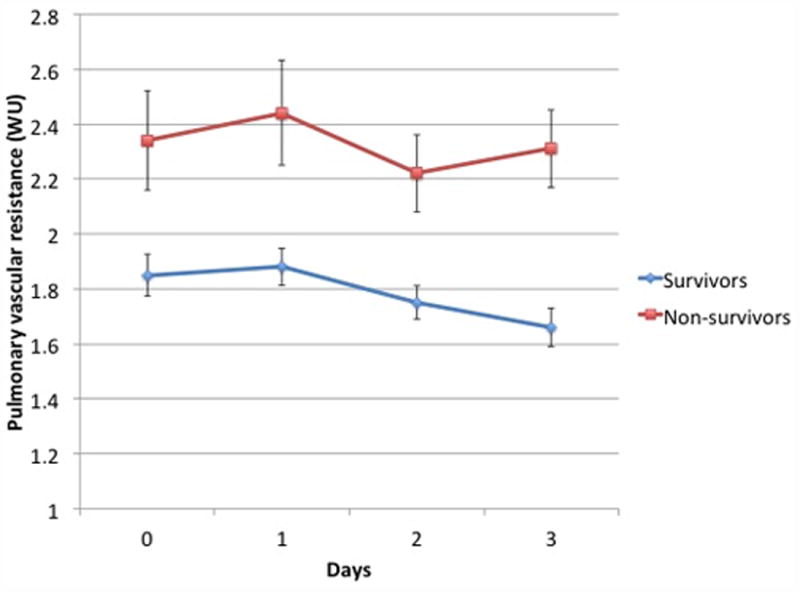
Panel A) Mean CPA on each of the first 4 trial days for subjects with available data at all 4 points who survived (N=209) versus those who died (N=71). CPA did not change over time for non-survivors (P = 0.9 for trend) whereas it increased over time in survivors (P = 0.02 for trend).Panel B) Mean PVR on each of the first 4 trial days for subjects with available data at all 4 points who survived (N=194) versus those who died (N=68). PVR did not change in survivors (P = 0.1 for trend) or non-survivors (P = 0.6 for trend).