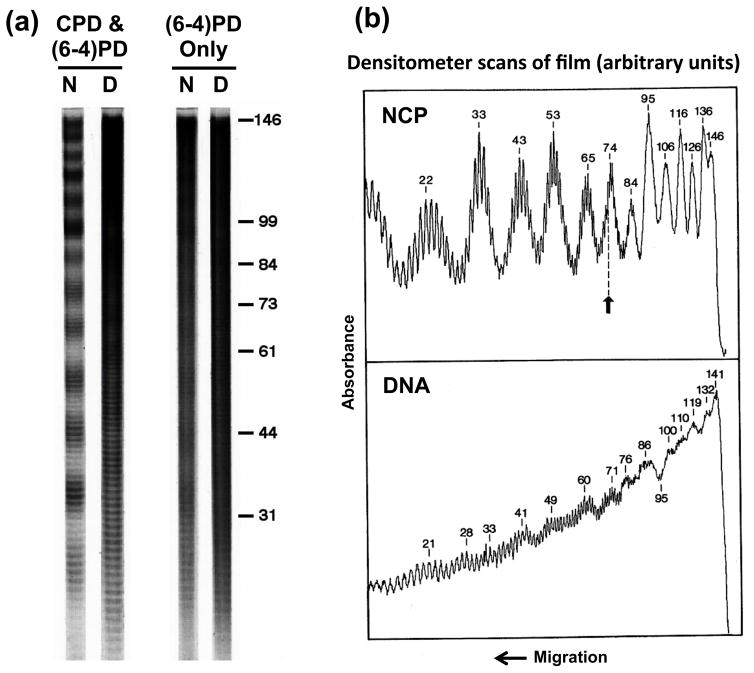
Figure 1. UV photofootprint of nucleosome core DNA.
(a) Distributions of UV-induced (6-4)PDs and CPDs in nucleosomal DNA. Nucleosome core DNA was digested with T4 DNA polymerase-exonuclease before and after DNA photolyase treatment and the digestion profiles are shown. Lanes [CPD&(6-4)PD], no photoreversal; lanes [(6-4)PD Only], photoreversal with DNA photolyase. N, UV-irradiated nucleosome; D, UV-irradiated naked DNA. [See reference (21) for details.] (b) Laser densitometer scans of T4 DNA polymerase-exonuclease digestion profiles of UV-irradiated nucleosomes (NCP), and UV-irradiated naked DNA (DNA). NCP panel, values denote the scan absorbance (in arbitrary units) vs. distance (in bases) from the 5’ end of core DNA. Arrow represents position of the nucleosome dyad axis. DNA panel, same as NCP, except that core DNA was first isolated and then irradiated with UV light. [See reference (20) for details.]

