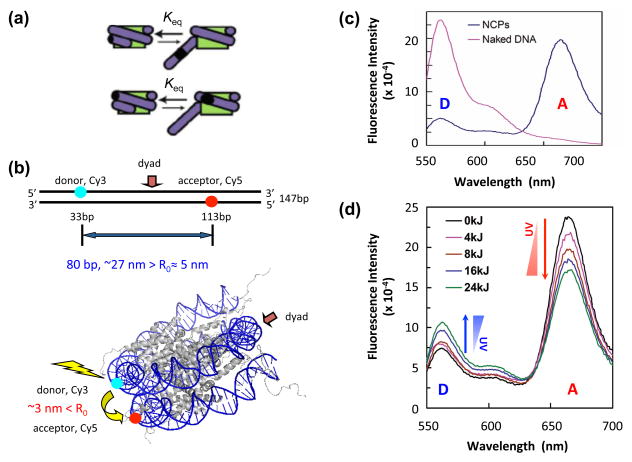
Figure 4. The dynamic changes of nucleosomal DNA revealed by FRET.
(a) Schematic diagram of DNA transient unwrapping dynamics in the nucleosome. The green internal disk represents histone octamer. Protein binding site is indicated as dark spot (black) on DNA (purple). [Adapted from: (88)]. (b) Locations of donor (Cy3) and acceptor (Cy5) dyes on the 147 bp 601 DNA sequence used for FRET. Upper panel shows locations of dyes on the naked DNA. The distance between the Cy3 and Cy5 on the naked DNA is ~27 nm, well beyond R0 (~5 nm) for the Cy3-Cy5 pair. Lower panel shows the dye locations on 601 NCPs. The distance between the dyes is ~3 nm in NCPs, significantly less than R0, yielding efficient energy transfer from donor to acceptor. The NCP model was generated from the crystal structure in PDB (accession number 1KX5). (c) Emission spectra revealed that energy transfer was only seen in the NCPs (blue) but not in naked DNA (pink). (d) FRET analysis demonstrates enhanced nucleosome unwrapping dynamics by UV damage. The 601 DNA was irradiated with different UV doses before reconstituted into NCPs. NCP Samples were excited at 515 nm and emission spectra recorded from 550 nm to 700 nm. Less efficient energy transfer is shown by increased donor emission and decreased acceptor emission, with increased UV doses. [Panels b-d are taken from reference (39).]

