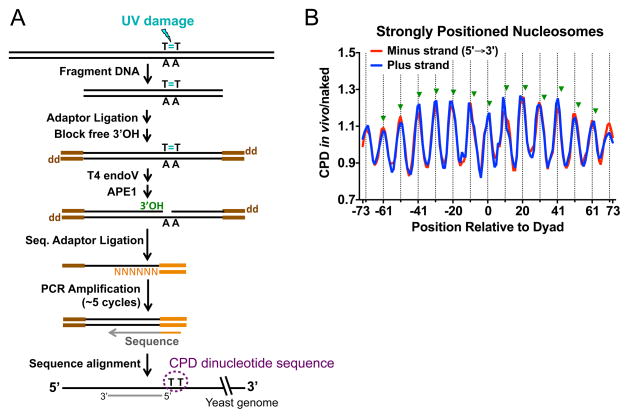
Figure 6. Mapping UV damage in the yeast genome using the CPD-seq method.
(A) Schematic of CPD-seq [adapted from (67)]. After fragmentation of genomic DNA isolated from UV-irradiated yeast cells, the trP1 adaptor (brown), containing a 3′ dideoxy group (denoted ‘dd’), is ligated to the free DNA ends. The remaining free 3′-OHs are further blocked by terminal transferase using ddATP as the substrate. DNA is subsequently digested with T4 endo V and APE1, to generate new 3′-OHs (green) specifically at CPD sites. The A adaptor (orange) is ligated to the free 3′-OH (green) immediately upstream of the CPD site. The resulting CPD library is briefly amplified with primers complementary to the trP1 and A adaptors and subjected to next-generation sequencing. Sequencing reads are mapped to the reference yeast genome to identify genomic locations and dinucleotide sequences of the CPDs. (B) CPD formation in vivo is enhanced at outward rotational settings (positions denoted by vertical dashed lines), but repressed at inward rotational settings in strongly positioned nucleosomes across the yeast genome. The scaled ratio of CPD formation in UV irradiated yeast (in vivo) relative to UV-irradiated naked DNA is plotted for the plus and minus strands of ~10,000 strongly positioned yeast nucleosomes. Green triangles indicate the locations of previously identified peaks of CPD formation (from the 3′ side of the CPD lesion) in mammalian chromatin, based on reference (20).

