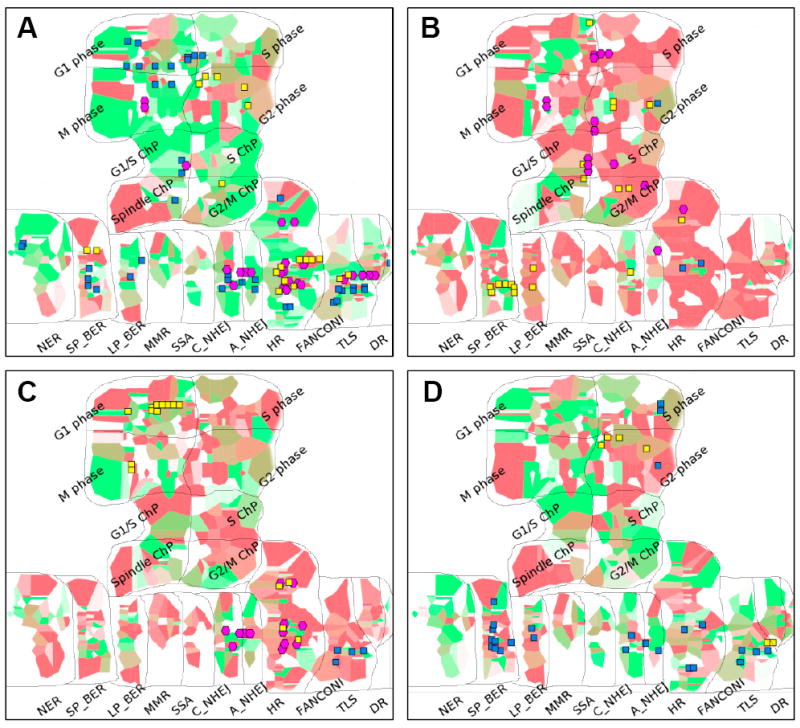
Figure 3. Molecular portraits of sensitivity to AsiDNA or olaparib in BC cell lines on DNA repair and cell cycle map.

Molecular portraits of BC cell lines according to their sensitivity to AsiDNA (A: sensitive cells; B: Resistant cells) and Ola (C: sensitive cells; D: Resistant cells) using gene expression, copy number variations and mutation frequency, projected on DNA repair and cell cycle map from ACSN. Red and green background colors respectively represent high and low mRNA expression levels across genes of a same pathway; intensity of color shows the level of the change to the mean value of the BC cell lines group. Copy number variations are represented as glyphs where yellow squares indicated copy number gains and blue indicate copy number losses. Mutations are represented using cyan diamonds. Abbreviations: G1/S ChP (G1/S checkpoint), S ChP (S checkpoint), G2/M ChP (G2/M checkpoint), Spindle ChP (Spindle checkpoint); SP_BER (Short-patch BER), LP_BER (Long-patch BER), C_NHEJ (Classical NHEJ), A_NHEJ (Alternative NHEJ).
