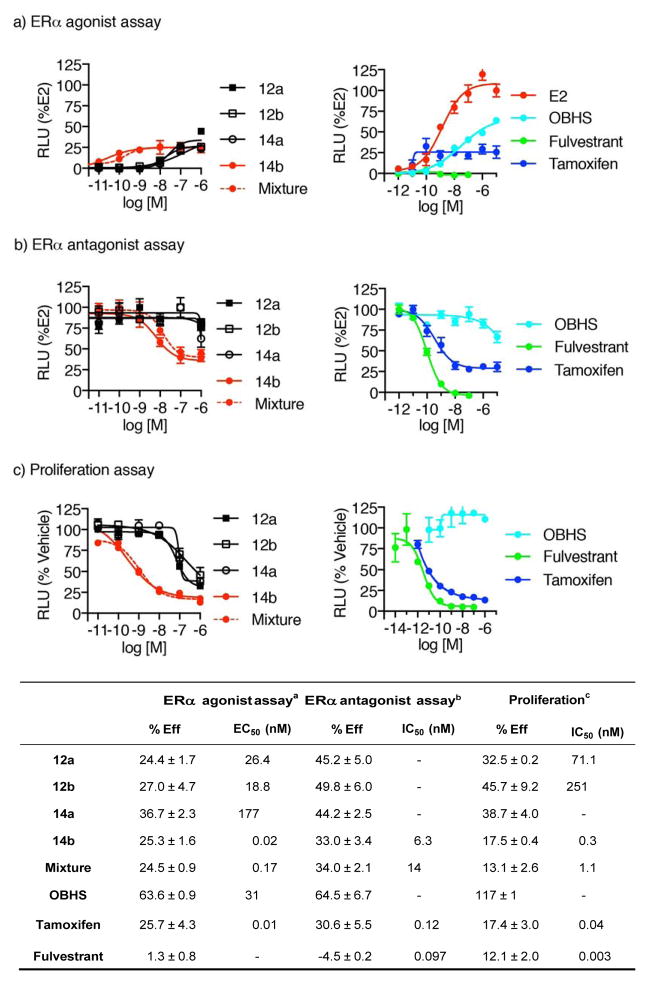
Figure 3.
Transcriptional and anti-proliferative profiles of OBHS-BSC stereo-and regioisomers. a) Luciferase activity was measured in HepG2 cells transfected with 3X-ERE-driven luciferase reporter and expression vectors encoding ERα and treated in triplicate with increasing doses (up to 10−5 M) of the isomers and control compounds (E2, OBHS, fulvestrant and hydroxytamoxifen). Data shown as a percent activity relative to 10−5 M E2. b) Luciferase activity was measured in HepG2 cells transfected with 3X-ERE-driven luciferase reporter and expression vectors encoding ERα, and treated in triplicate with increasing doses (up to 10−5 M) of the isomers in the presence of 10 nM E2 and control compounds (OBHS, fulvestrant and hydroxytamoxifen). Data is shown as a percent activity relative to 10−5 M E2. c) Proliferation was measured in MCF-7 cells treated in triplicate with increasing doses (up to 10−5 M) of the isomers and control compounds (E2, OBHS, fulvestrant and hydroxytamoxifen). Data is shown as a percent activity relative to vehicle. In the tabular summary, aAverage efficacy (mean ± s.e.m.) and EC50 values were determined for experiments shown in Figure 3a. bAverage efficacy (mean ± s.e.m.) and IC50 values were determined for experiments shown in Figure 3b. cAverage efficacy (mean ± s.e.m.) and IC50 values were determined for experiments shown in Figure 3c. EC50 and IC50 values for some compounds could not be determined (−).

