
Figure 1. Ibrutinib-induced cell death in purified paired CLL cells (ibrutinib dose-response curves).
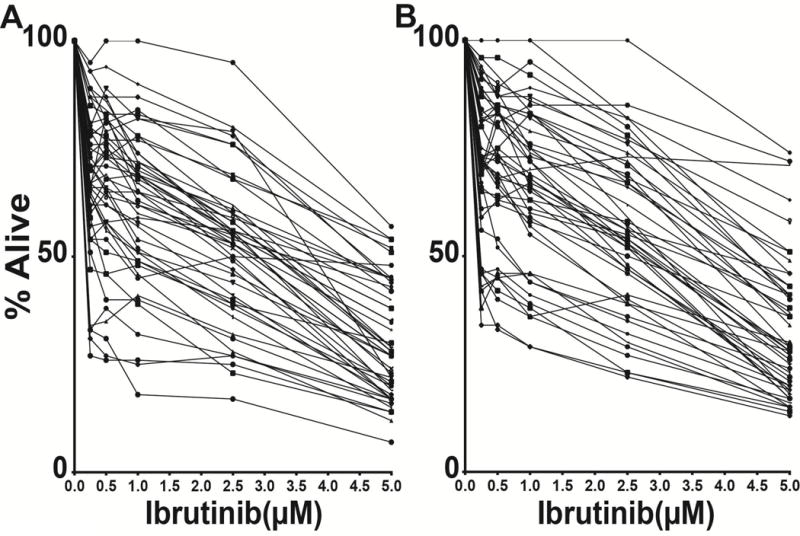
CD19+ CLL cells purified through negative selection were incubated with escalating doses of ibrutinib for 72 hours and the apoptotic and necrotic cell population measured using annexinV/PI staining and FACS. Displayed is the viable double-negative (DN) cell fraction normalized to the individual DN fraction measured in the solvent only controls. The mean of duplicate drug incubations and measurements is displayed. A: pre-treatment CLL samples; B: post-treatment (relapsed) CLL samples.