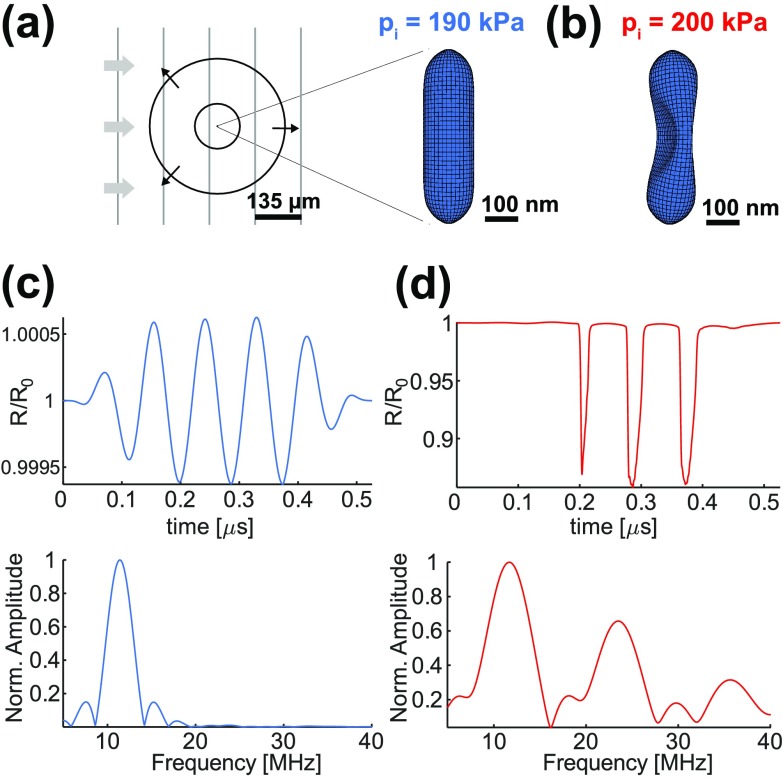
FIG. 1.
Simulation of the hGV shell response to incoming ultrasound imaging pulses. (a) Diagram and finite element simulation of hGV shell deformation at 190 kPa and (b) at 200 kPa peak positive incident pressures (pi). Gray lines represent an incident excitation wave, while black circles represent scattered wave. (c) Simulated radial excursion at 190 kPa normalized to the resting radius R0 (top) and corresponding Fourier transform (bottom). (d) Simulated radial excursion at 200 kPa normalized to the resting radius R0 and corresponding Fourier transform.

