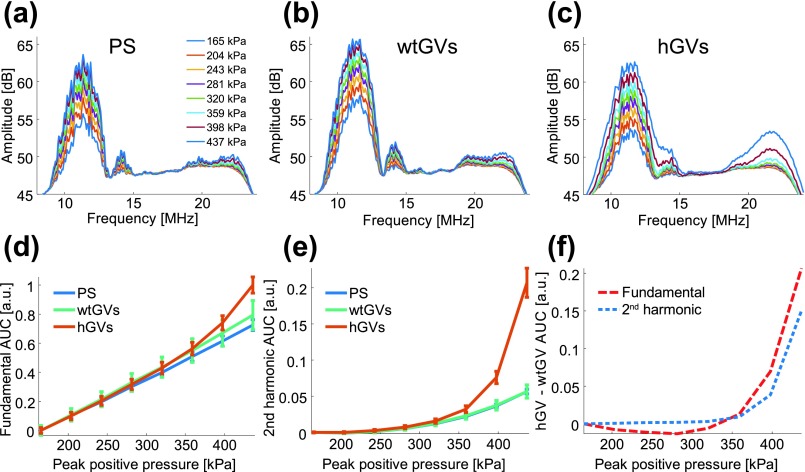
FIG. 2.
Experimental spectra of backscattered signals from PS, wt GVs, and hGVs. (a) PS spectra, (b) wtGVs spectra and (c) hGVs spectra in response to varying peak positive incident pressures. (d) Fundamental area under the curve (AUC) integrated from 9.5 MHz to 13 MHz as a function of pressure (N = 5 samples; error bars represent standard error of the mean). (e) Second harmonic AUC integrated from 19 MHz to 26 MHz as a function of pressure (N = 5 samples; error bars represent standard error of the mean). (f) Differential AUC response between hGVs and wtGVs at the fundamental (dashed red line) and second harmonic frequency (dashed blue line).

