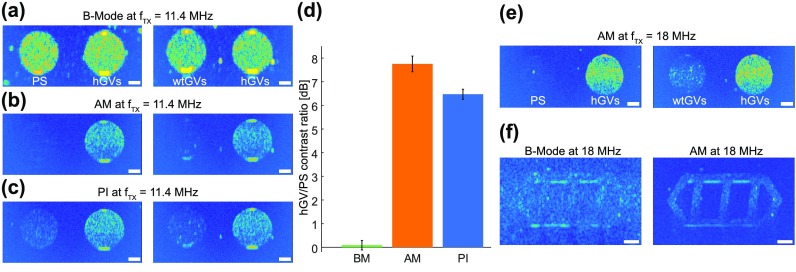
FIG. 4.
In vitro nonlinear imaging of hGVs versus PS and wtGVs. (a) Conventional ultrasound B-Mode imaging acquired using 11.4 MHz 6-cycle sine-bursts. Left, phantom image comparing PS to hGVs. Right, phantom image comparing wtGVs to hGVs. (b) Amplitude modulation pulse sequence consisting of the sequential transmission of one full amplitude and two half-amplitude 11.4 MHz 6-cycle sine bursts. Left, phantom image comparing PS to hGVs. Right, phantom image comparing wtGVs to hGVs. (c) Pulse inversion sequence consisting of the sequential transmission of two phase inverted 11.4 MHz 6-cycle sine bursts. Left, phantom image comparing PS to hGVs. Right, phantom image comparing wtGVs to hGVs. (d) Ratios of hGV to PS contrast at 11.4 MHz for B-Mode, amplitude modulation and pulse inversion imaging (N = 5 samples; error bars represent standard error of the mean). (e) Amplitude modulation images at 18 MHz. Left, PS versus hGVs. Right, wtGVs to hGVs. (f) Selective amplitude modulation imaging of hGVs embedded within a phantom filled with PS. Scale bars represent 1 mm. PS and wtGV inclusions were imaged at a depth of 8 mm.

