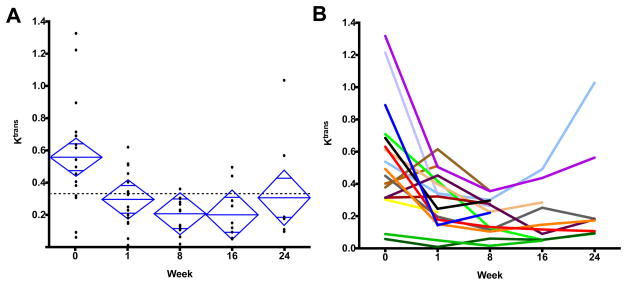
Figure 1.
(A) Individual dynamic contrast magnetic resonance imaging (DCE-MRI) derived Ktrans values (min−1) plotted at each time point. The top and bottom of each diamond represent the 95% confidence interval for each group. (B) Ktrans values (min−1) plotted across each time point by individual patient. Each color represents an individual patient, with trend line shown over the course of the study.

