Figure 1.

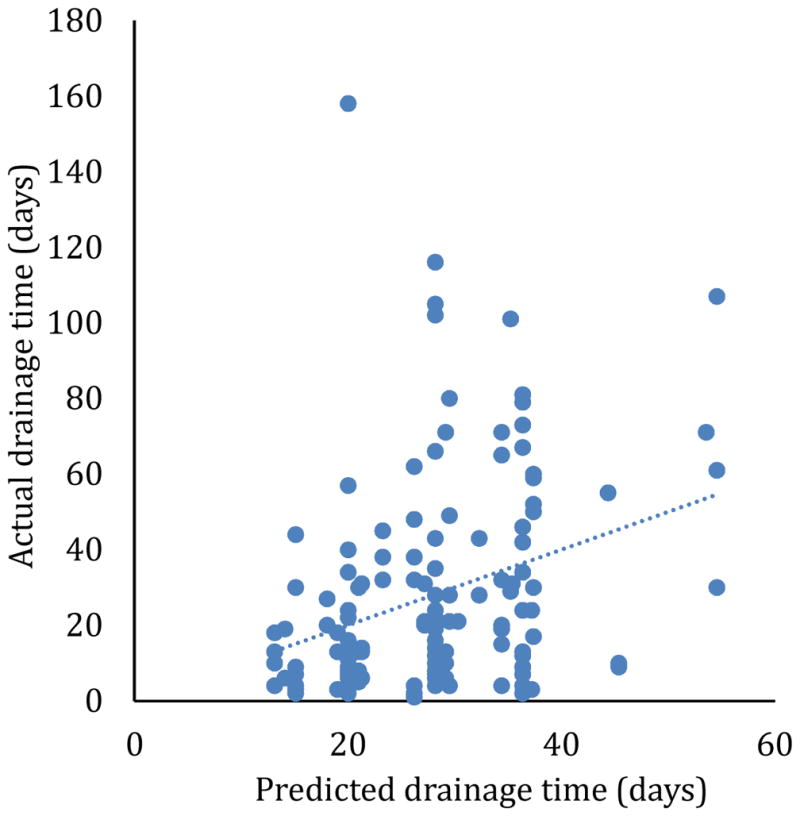
Predicted versus actual drainage time, using the model in Table 3. The correlation between the predicted and actual drainage times has r2 = 0.10, and the regression line has a non-zero slope (p=8.9×10⁻⁵).

Predicted versus actual drainage time, using the model in Table 3. The correlation between the predicted and actual drainage times has r2 = 0.10, and the regression line has a non-zero slope (p=8.9×10⁻⁵).