Fig. 3.
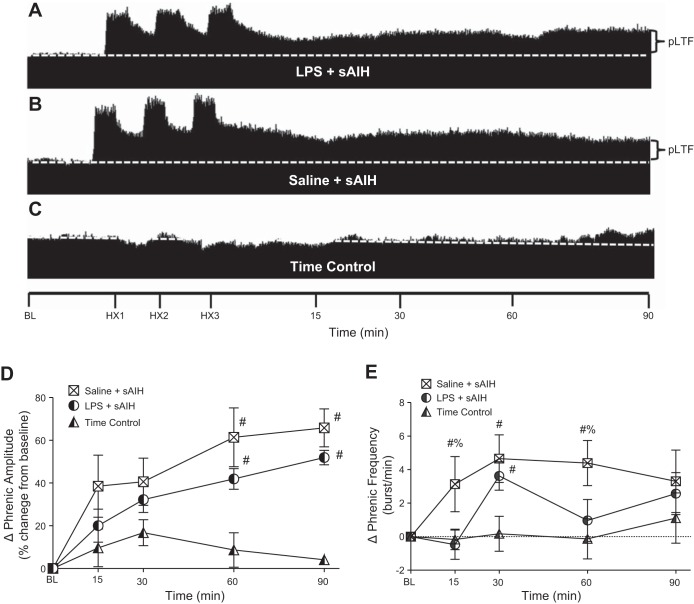
LPS-induced systemic inflammation (100 μg/kg; 24 h prior) does not affect pLTF elicited by sAIH. A–C: representative traces of compressed integrated phrenic neurograms during sAIH protocol. A: LPS treatment exposed to sAIH shows increased amplitude from baseline (BL). B: saline treatment exposed to sAIH shows increased amplitude from BL. C: time control animals without sAIH do not exhibit pLTF. D: group data for phrenic amplitude as a %change from BL. LPS + sAIH (circles; n = 8) and saline + sAIH (squares; n = 8) are compared with time control protocols (triangles; n = 8). After sAIH, there was a rapid increase from BL values and the increase persisted for 90 min. There was no difference between LPS + sAIH vs. saline + sAIH at any time (BL, 15, 30, 60, or 90 min; P > 0.05). #P > 0.05 indicates a significant difference from time control. E: group data for phrenic burst frequency (bursts/min). LPS + sAIH and saline + sAIH are compared with time controls. The LPS + sAIH group was significantly different from time control only at 30 min and significantly different from saline + sAIH at 15 and 60 min. The saline + sAIH group was significantly different from time control at 15, 30, and 60 min. #P > 0.05 indicates a significant difference from time control. %P > 0.05 indicates a significant difference from LPS + sAIH.

